[Updated on 08-02-2018] SMOG sensor – 2,5 and 10μm particles
[Updated on 08-02-2018] SMOG sensor – 2,5 and 10μm particles
Last changes:
07-11-2017: Additional data from richer stations, Open-Smog Integration
20-12-2017: USB power control on Raspberry Pi 3, thanks to reader
02-03-2018: New API from GIOŚ Poland
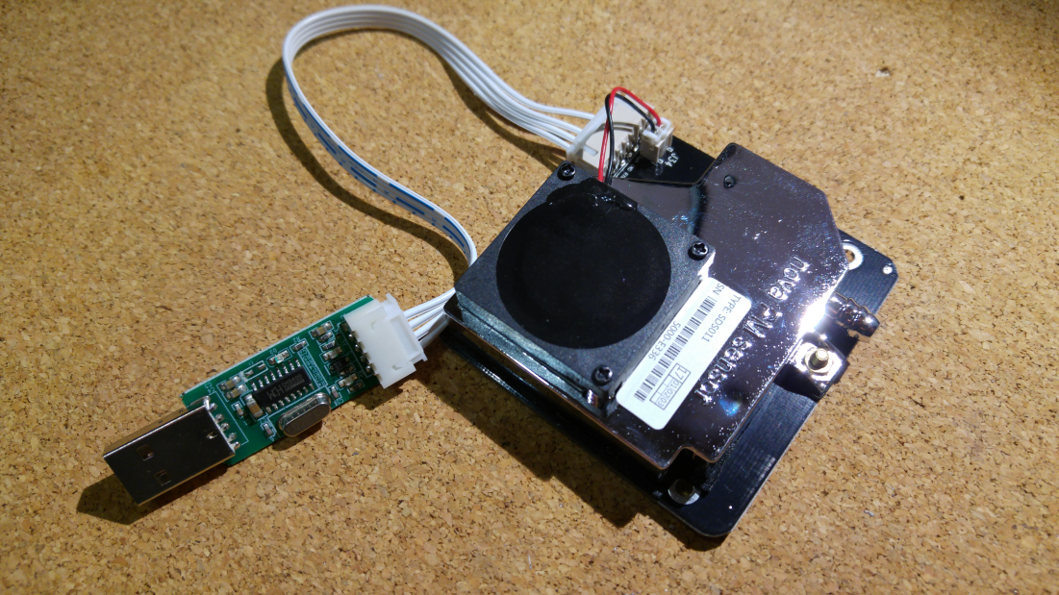
SMOG is common nowadays in big cities. Let’s put together a working, precise own SMOG sensor, first for the 2,5 and 10 μm size particles. There is one issue – the choices are many, but only few are reliable, precise and have affordable price. Finally – after a log searching, I’ve chosen Nova Fitness SDS011:
- precision is OK
- fan included
- ability to mount a small tube to access external air
- very realiable
- UART with USB converter included
- Low Total cost: around $40 (with Orange Pi Zero) up to $60 (with Raspberry Pi)
What will you need?
Hardware:
- Raspberry Pi or clone (Orange Pi) with one USB port free
- Nova Fitness SDS011 sensor with USB-UART included in package, the cheapest to get it is usually on Aliexpress
Software:
- favourite distibution – Raspbian or Armbian for clones
- basic software included or optional in those distributions
Setup, configuration and graphs
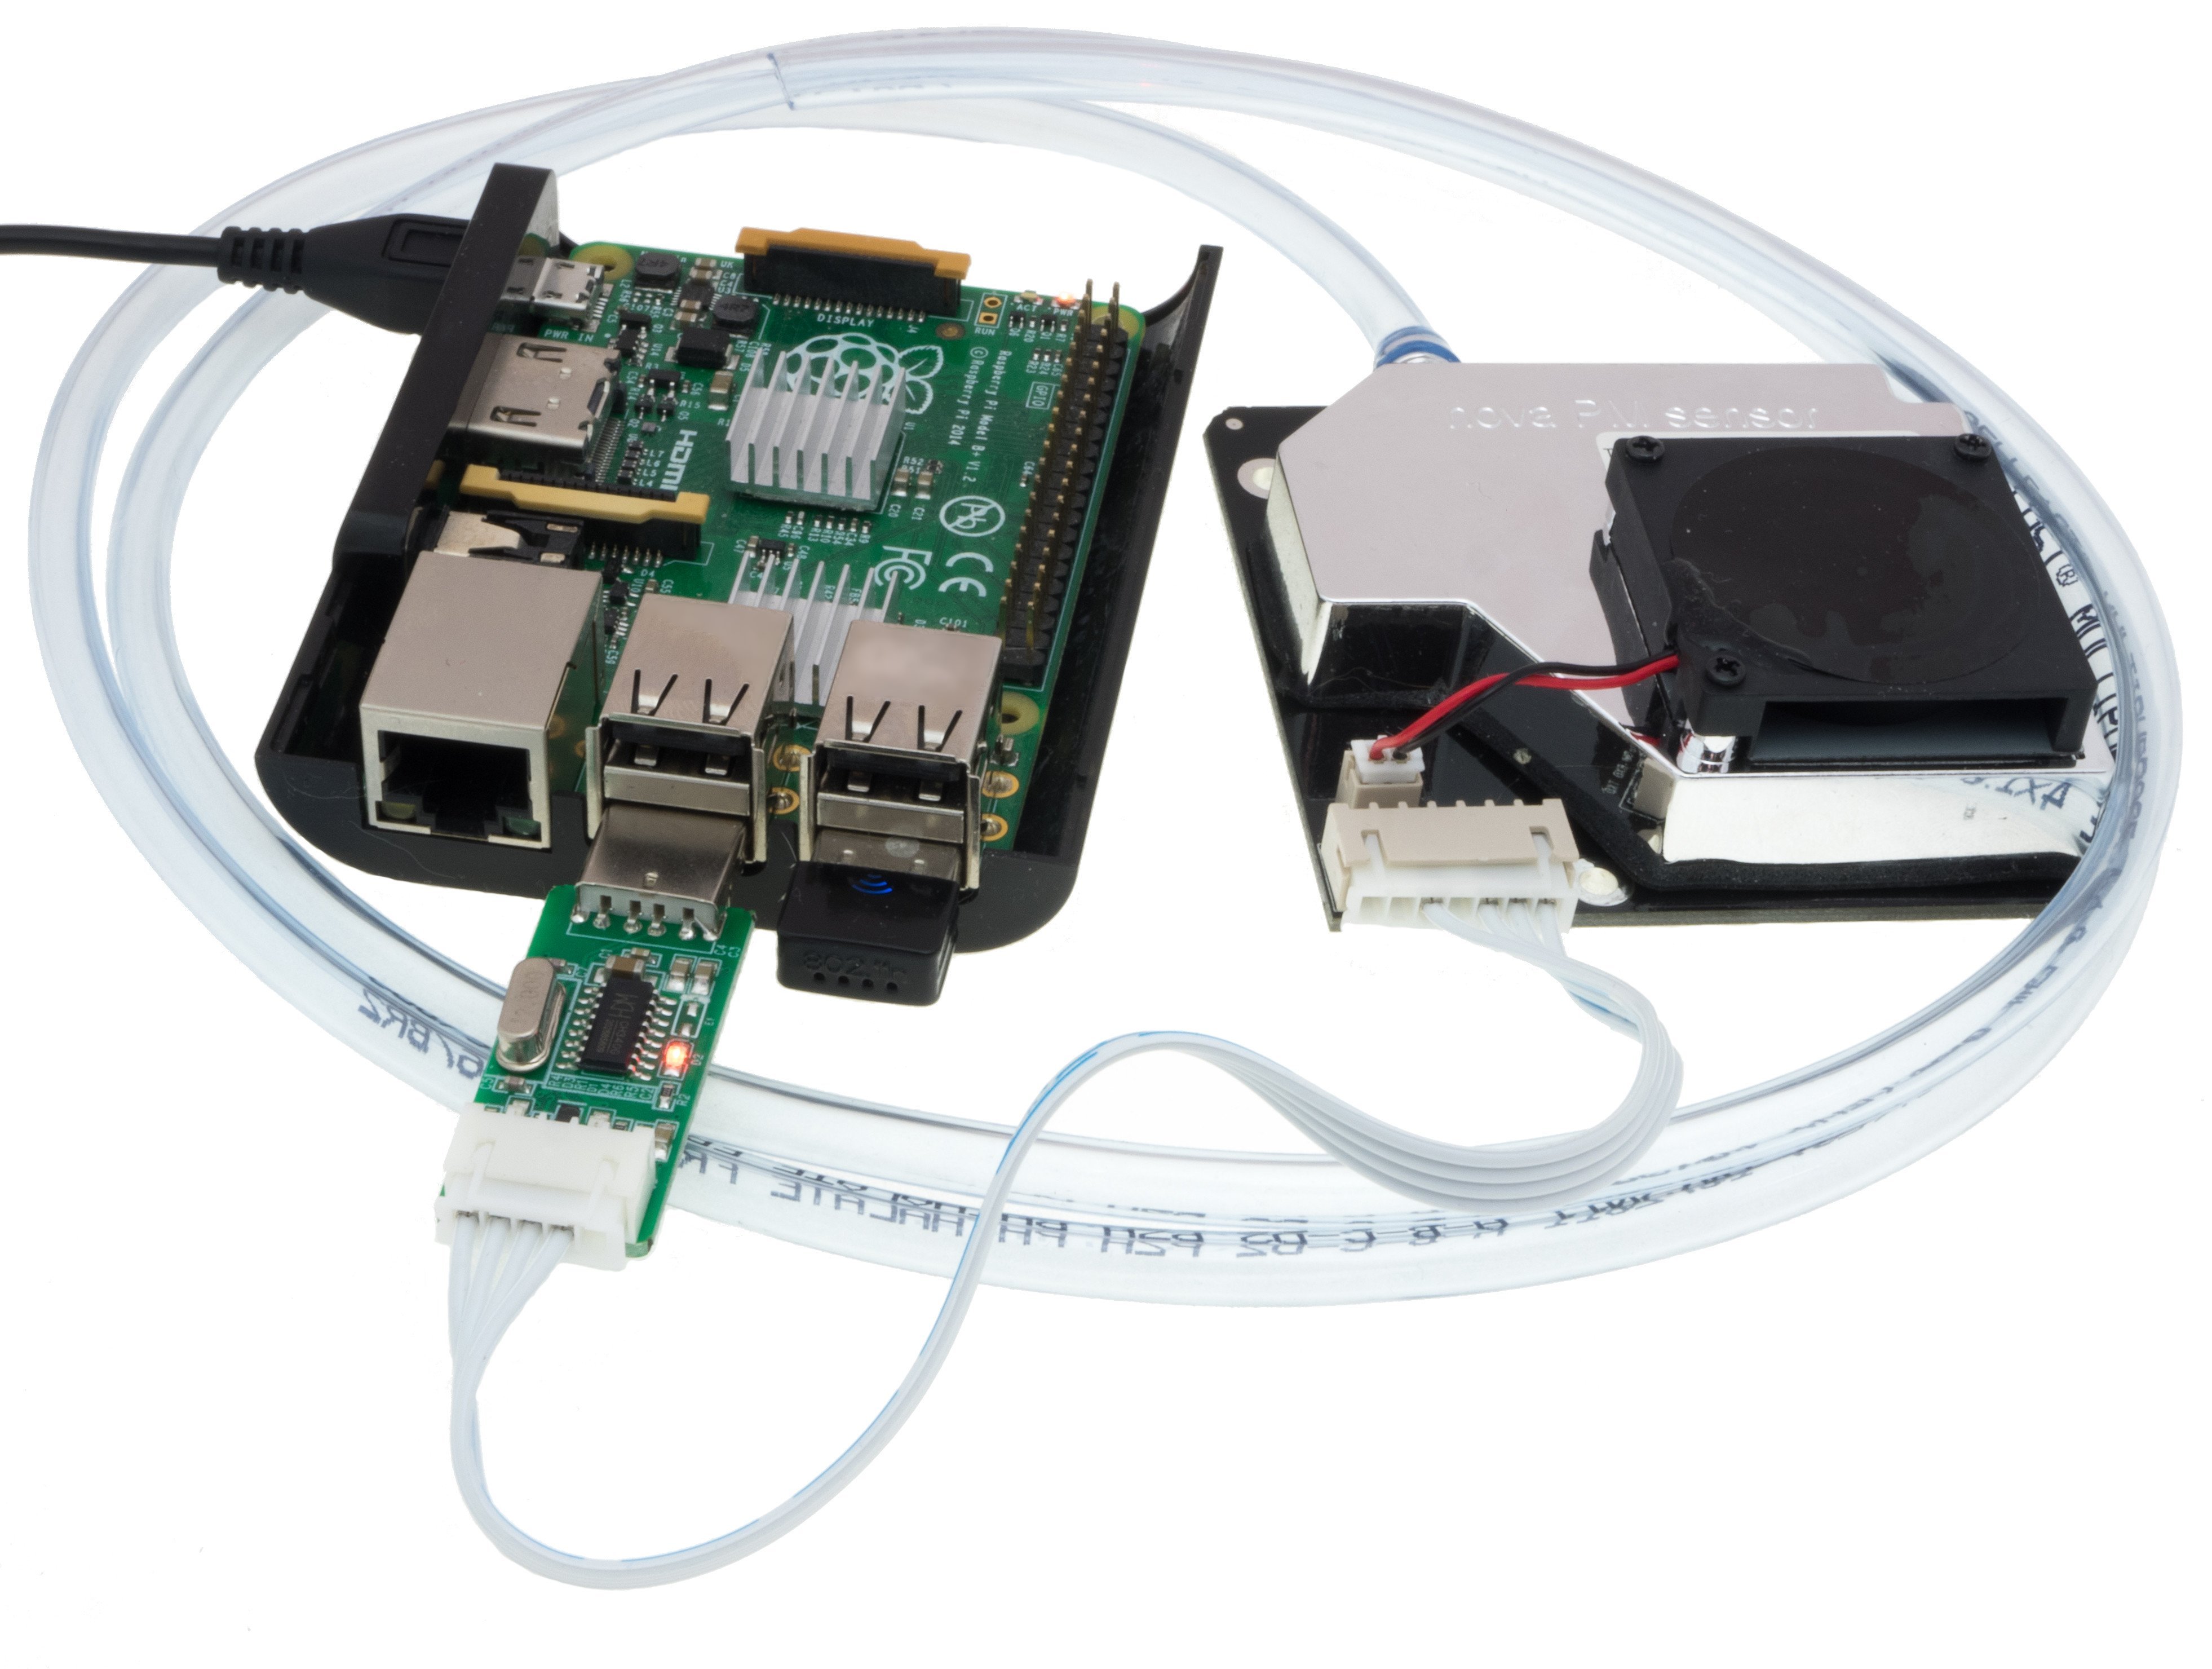
The SDS011 should be connected to outside air via the duct and possibly very short tube (few cm). The picture above with the tube length of 100cm – is not advised the results are much lower than in real life.
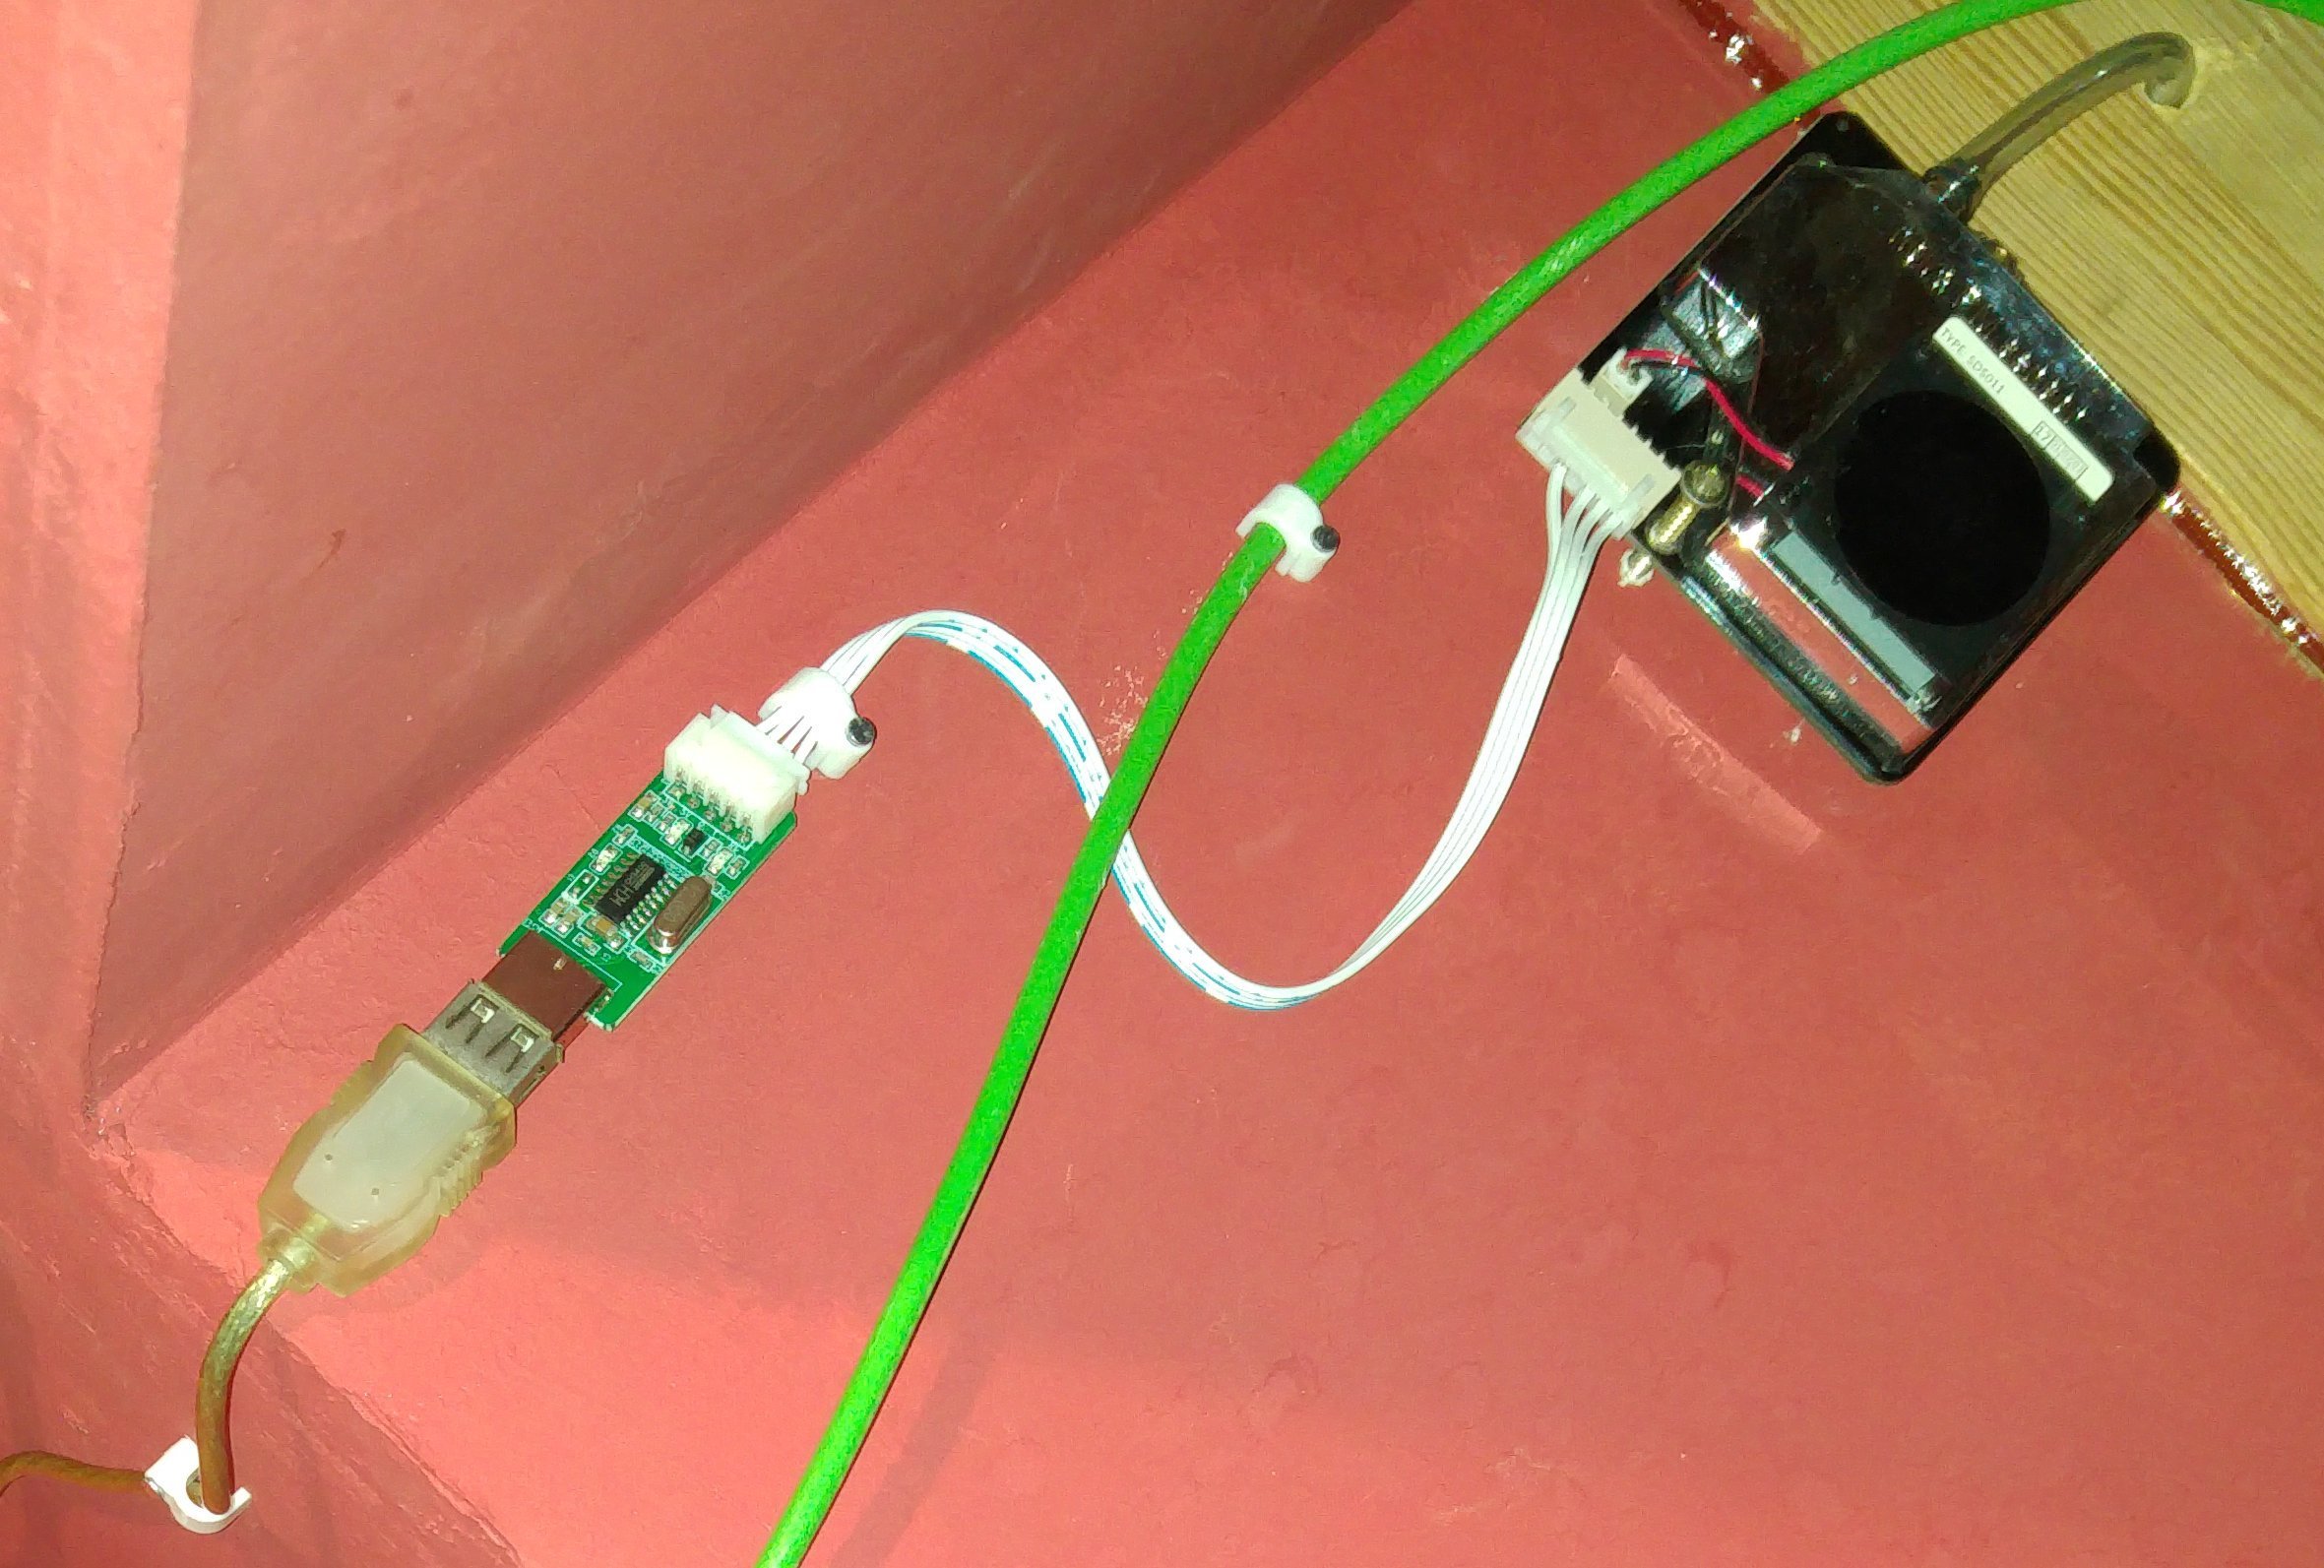
Don’t forget that the sensor works constantly, so we will try to turn it on – only for the time of actual measurement. This version has a very simple solution – using Orange Pi with A20 CPU, I can selectively power the USB port pairs.
Another important caveat – sensor works only up to 70% of humidity, don’t forget that!
First – let’s install bc – needed for caluclations:apt update apt upgrade apt install bc gitThis is the first version of the sensor – meaning we will modify it for the extra humidity.
The communication with SDS011 is very simple – after inserting the delivered dongle in USB port we get the /dev/ttyUSB0 serial port – that we can use to read the data:/bin/stty -F /dev/ttyUSB0 9600 raw /usr/bin/od --endian=big -x -N10 < /dev/ttyUSB0The data needs to be parsed to find "aac0" (SDS011 talks in hex, big endian), and the final value needs to be calculated. The whole code with updating the IndluxDB so Grafana can present nice graphs is here. Added comments to explain, used bash for simplicity:
Version of the script for any SBC/computer - here using Orange Pi:
#!/bin/bash
# SDS011 reader, assuming that USB is at /dev/ttyUSB0
# Based on: http://kuehnast.com/s9y/archives/633-Feinstaubmessung_mit_dem_Raspberry_Pi.html
# [email protected], 2017, NO WARRANTY, GPL v2
#
# Variables - change if needed
serial_port="/dev/ttyUSB0"
#Turning on USB port - this is only for Orange Pi (A20)!
/usr/bin/sunxi-pio -m PH26''
#Let's wait until the airflow stablizes
sleep 60
#Main program
#Setting the serial port parameters
/bin/stty -F $serial_port 9600 raw
#Reading data - big-endian, hex
RAW_DATA=`/usr/bin/od --endian=big -x -N10 < /dev/ttyUSB0 | /usr/bin/head -n 1 | /usr/bin/cut -f2-10 -d" "`
HEADER=`echo $RAW_DATA | /usr/bin/awk '{print $1}'`
#Probe for proper header
if [ "$HEADER" = "aac0" ];
 then
  #Let us cut the RAW DATA and put it into variables - data is in hexadecimals
  HEX_PPM25_L=$(echo $RAW_DATA|cut -f2 -d " "|cut -b1-2);
  HEX_PPM25_H=$(echo $RAW_DATA|cut -f2 -d " "|cut -b3-4);
  HEX_PPM10_L=$(echo $RAW_DATA|cut -f3 -d " "|cut -b1-2);
  HEX_PPM10_H=$(echo $RAW_DATA|cut -f3 -d " "|cut -b3-4);
  #Convert variables to decimals
  PPM25_L=$(echo $((0x$HEX_PPM25_L)));
  PPM25_H=$(echo $((0x$HEX_PPM25_H)));
  PPM10_L=$(echo $((0x$HEX_PPM10_L)));
  PPM10_H=$(echo $((0x$HEX_PPM10_H)));
  #More simple math
  PPM25=`echo "((${PPM25_H}*256)+${PPM25_L})/10" | bc`
  PPM10=`echo "((${PPM10_H}*256)+${PPM10_L})/10" | bc`
  #Update the local InfluxDB
  /usr/bin/curl -i -XPOST 'http://127.0.0.1:8086/write?db=smogdb' --data-binary "ppm25sds011 value=${PPM25}"
  /usr/bin/curl -i -XPOST 'http://127.0.0.1:8086/write?db=smogdb' --data-binary "ppm10sds011 value=${PPM10}"
 else
  echo HEADER ERROR
 fi
#Turining OFF the USB ports for Orange Pi
/usr/bin/sunxi-pio -m PH26''
Version for Raspberry Pi 3
Thanks to reader of the blog - Piotrek Pilek (cheers man!), we have also an option to control power on Raspberry Pi USB ports! (Piotr works at Lantech in Szczecin - check out this gem - https://lantech.com.pl/internet_szczecin_oferta/transmisje-live/)
Now, the control of power to USB port can be achieved by using Vadim's Mikhailov, who created software for multiple powered USB hubs, Raspberry Pi included. Install the software:
cd ~
sudo apt install libusb-1.0 libusb-dev
git clone https://github.com/mvp/uhubctl
cd uhubctl
make
sudo make install
Then, modify the lines in the example above (in the first lines):
/usr/bin/sunxi-pio -m PH26''to
/usr/sbin/uhubctl -a off -p 2And the same at the end of the file:
/usr/bin/sunxi-pio -m PH26''to
/usr/sbin/uhubctl -a on -p 2Caution - this command shuts down all USB ports, but not eth0 nor wlan0
Now, lets draw...
...the results just like last time in Grafana, the definitions are as follows:
SELECT last("value") FROM "ppm25sds011" WHERE $timeFilter GROUP BY time(1m) fill(none)
SELECT last("value") FROM "ppm10sds011" WHERE $timeFilter GROUP BY time(1m) fill(none)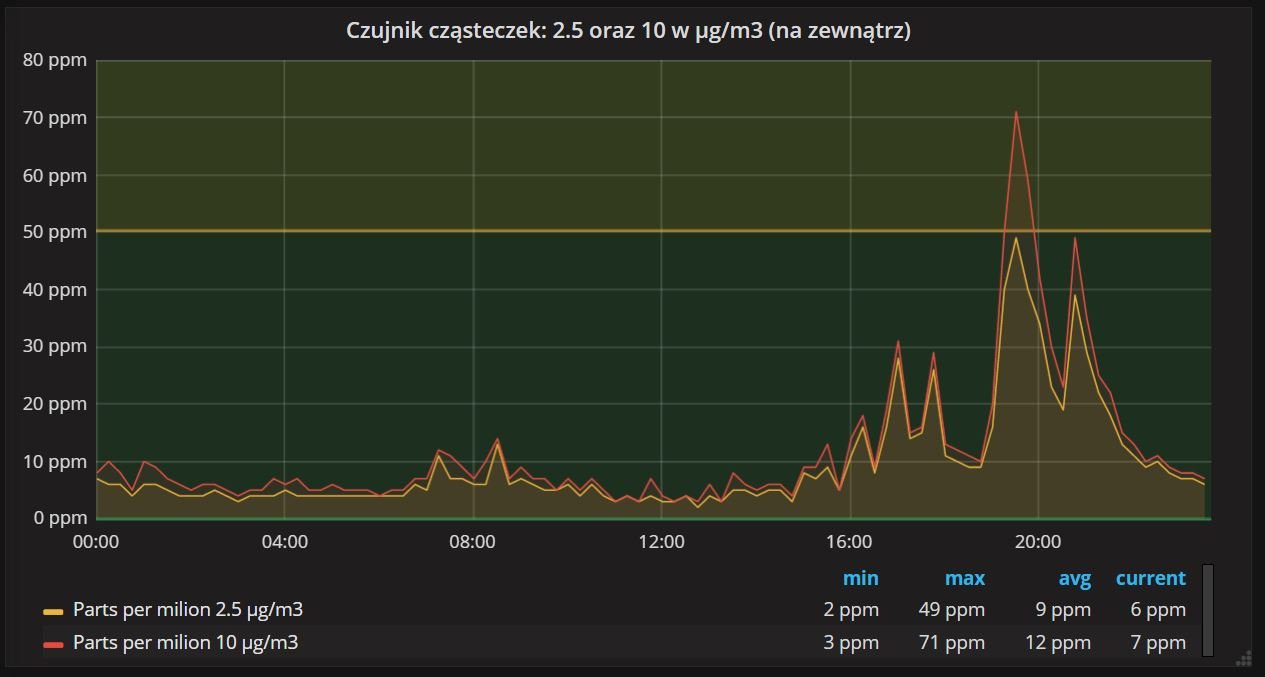
And that is it!
Sharing the data, external systems. Do you run your own project?
Our SMOG data are available and easy to share. If you run a system that gathers such data - write in comments - I'll setup connection to your project and update this entry.
Current measurements, updated every 15 minutes are available at http://pogoda.jokielowie.com/
OpenSmog integration
Open-Smog is a new project, based on Artur's Kurasiński idea. For details - check out Slacka: https://open-smog.slack.com/
Integration is simple - just add at the end of script:
curl -X POST --header 'Content-Type: application/json' --header 'Accept: application/json' -d "[ { \"data\": { \"pm2_5\": ${PPM25}, \"pm10\": ${PPM10}, \"temp\": ${temperature}, \"hum\": ${humidity} } } ]" 'http://ADRES_WWW_OPENSMOG/v1/Sensors/TWOJEID/data'I promised easy, right ?
Pobieranie danych i weryfikacja ze stacjami WIOŚ
Getting the data from regional smog sensors - Polish voivodeship - WIOŚ
OF course you're curios how precise is our sensor. To verify - we can add official data from WIOŚ sensor: the map is here: http://powietrze.gios.gov.pl/pjp/current. Choose the sensor near you - here it's the one at Koszyka Streen in Opol, that has this particular address (mind the ID): http://powietrze.gios.gov.pl/pjp/current/station_details/chart/10374. As pointed by Krzysztof Styc on Domoticz group - the WIOŚ share the current measurment in JSON format. Then around the end of 2017, they chnged it to new API at the address: http://powietrze.gios.gov.pl/pjp/content/api
This allows us to quickly get this data and put it to InfluxDB too - adding just couple of lines to our script:
http://api.gios.gov.pl/pjp-api/rest/station/findAll
Of course the script will vary from sensor - some give out much more data - the line needs to be modified (it's usually about another print $7, print $8 etc.), i.e. for this Warsaw station, we can get more data:
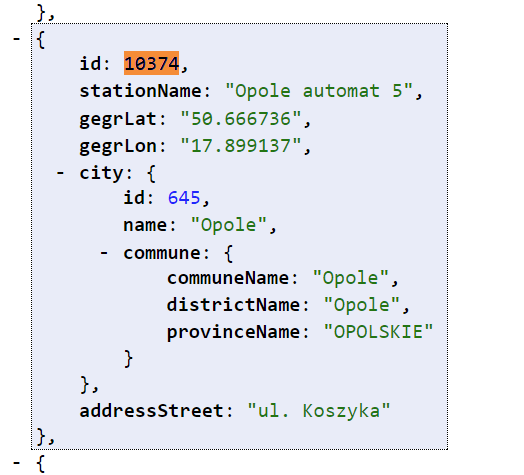
With StationID – enter them in URL, that shows the measurments:
http://api.gios.gov.pl/pjp-api/rest/station/sensors/10374
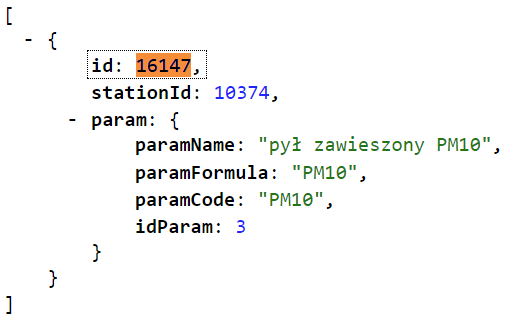
Thos is our ID:
http://api.gios.gov.pl/pjp-api/rest/data/getData/16147
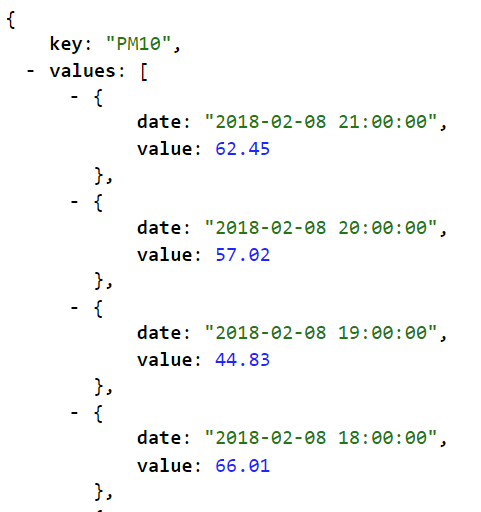
Modify the script:
city_wios_station=`curl -s http://api.gios.gov.pl/pjp-api/rest/data/getData/16147 | awk -F, '{print $3}' | sed -e 's/}/:/g' | awk -F: '{print $2}'`
if [ $city_wios_station = "null" ] ; then
  city_wios_station=`curl -s http://api.gios.gov.pl/pjp-api/rest/data/getData/16147 | awk -F, '{print $5}' | sed -e 's/}/:/g' | awk -F: '{print $2}'`
fi
/usr/bin/curl -i -XPOST 'http://127.0.0.1:8086/write?db=smogdb' --data-binary "ppm10_city_wios_station value=${city_wios_station}"
After modification, we can get new variables i.e. PM10 or NO2
Our Grafana graph should now get new data (you can choose which to add in similar manner) - that we can put up against our own sensor data.
The actual visualized data, updated every 60 minutes, are available under http://weather.jokielowie.com/.
Gauges - current SMOG data via WWW
The up-to-date information about particles in cubic meter can be also presented as gauges. Popular library with easy examples JavaScript that work in most browsers is present at: http://justgage.com/:

Downdload the ZIP called "justgauge", unpack. Now lets prepare RAW version of our webpage. We will update it via InfluxDB - using stored temperature and humidity to find out if our measurements are correct.
Here's the RAW version:
Weather station
Stacja pogodowa SMOG w ... /SMOG Weather Station in ...
<div id="zegar1"></div>
<div id="zegar2"></div>
<div id="zegar3"></div>
<div id="zegar4"></div>
<script src="raphael-2.1.4.min.js"></script>
<script src="justgage.js"></script>
<script>
      var zegar1, zegar2, zegar3, zegar4;
      window.onload = function(){
        var zegar1 = new JustGage({
          id: "zegar1",
          value: __ppm25__,
          min: 0,
          max: 300,
          title: "Cząsteczki 2,5µm",
          label: "µg/m^3"
        });
        var zegar2 = new JustGage({
          id: "zegar2",
          value: __ppm10__,
          min: 0,
          max: 300,
          title: "Cząsteczki 10µm",
          label: "µg/m^3"
        });
        var zegar3 = new JustGage({
          id: "zegar3",
          value: __temperature__,
          min: -40,
          max: 60,
          title: "Temperatura",
          label: "st C"
        });
        var zegar4 = new JustGage({
          id: "zegar4",
          value: __humidity__,
          min: 0,
          max: 100,
          title: "Wilgotność",
          label: "%"
        });
      };
    </script>
Save it as raw-index.html
The main script already has the values for 2,5 and 10 (ppm). Let's incorporate them by adding lines to the script dodają te line also with temperature and humidity. In my InfluxDB example - they are named as "temperatura_out" and "wilgotnosc_out" - change them to your measured values as well as IP and database - and then - add those lines at the end of the script:
temperature=`/usr/bin/curl -s -G 'http://127.0.0.1:8086/query' --data-urlencode "db=ZMIEN_MNIE" --data-urlencode "q=SELECT last(\"value\") FROM \"temperatura_out\"" | /bin/sed -e 's/[{}]/''/g' | /usr//bin/awk -v k="text" '{n=split($0,a,","); print a[n]}' | tr -d "[\]]"`
humidity=`/usr/bin/curl -s -G 'http://127.0.0.1:8086/query' --data-urlencode "db=ZMIEN_MNIE" --data-urlencode "q=SELECT last(\"value\") FROM \"wilgotnosc_out\"" | /bin/sed -e 's/[{}]/''/g' | /usr//bin/awk -v k="text" '{n=split($0,a,","); print a[n]}' | tr -d "[\]]"`
Ready! Let's process our RAW index file and swap the values for real ones:
sed -e "s/__temperature__/${temperature}/g" -e "s/__humidity__/${humidity}/g" -e "s/__ppm25__/${PPM25}/g" -e "s/__ppm10__/${PPM10}/g" < raw-index.html > index.htmlThe index.html file could be now sent to external hosting after using "ssh keygen" and "ssh-copy-id":
scp index.html [email protected]:/var/www/pogoda.host.com/html/index.htmlIf you got those line in order - in the main script - each launch will update the file on the remote server!