Download, integration and presentation of data from Tauron's eLicznik - photovoltaic power plant with custom charts
Tauron Polska Energia as one of several operators - provides its customers with remote readings of received energy from newly installed electricity meters with a wireless module - most often labeled AMI, Smart or 3G. Currently, in the first half of 2019, residents of Wroclaw and surrounding areas (AMI Plus program) can use such meters.
UPDATE: April 2020 - Tauron has changed the data format - it is now CSV. Please update (Github - clone)
What interests us, however, is the situation in which we switch to a prosumer contract - so we start generating our own electricity - usually from a photovoltaic system, although . Tauron, within a month of reporting a private prosumer power plant, replaces the meter with a smart meter, and the prosumer gets access to interesting data:
- electricity consumption with hourly resolution.
- electricity generation with hourly resolution.
So it remains to automatically download this data and match it with data from your own power plant. After a brief exchange of questions - Tauron answered that it does not provide a special API, but you can download the data - updated every hour - in Microsoft Excel file format. So let's download it and integrate it with our own data:
What we will need?
Hardware:
- Raspberry Pi (version 2 or later) or other server/computer/mini computer - SBC - with a minimum of 1GB RAM, 8GB disk or flash card.
- own power plant (e.g.: photovoltaic) connected to the power grid, active prosumer contract with Tauron.
- optional - ability to download online data from own power plant.
Software:
- Linux: standard Raspberry Pi OS (formerly Raspbian) - for Raspberry Pi, or Debian derivative on other computers.
- python, Firefox, installed as operating system packages.
- Note - although we will be using a browser - we do not need to connect a mouse, keyboard or monitor to the RPi. We will work in a virtual screen
- Installed on Raspberry Pi - Grafana and InfluxDB - you will find in this recipe.
- active account on https://elicznik.tauron-dystrybucja.pl/
- optional: software https://www.tightvnc.com/ - allowing remote control of the computer in graphical/GUI mode.
Let's do it
Since I was mainly interested in the data - and not in discussing how to access the data online - I decided that I would simply assemble a so-called "monster" - at a minimal cost in time and expense - but automatically and daily update charts based on data from the power plant and Tauron. After not very deep analysis, I decided to adopt the following scenario:
- a script that retrieves data from the Tauron site, marking - just like a person working with a browser - the data I am interested in. They need data from the last day, which includes the energy received and the energy returned to the grid. I will get from the whole month and overwrite them, but it is the cost of simplicity
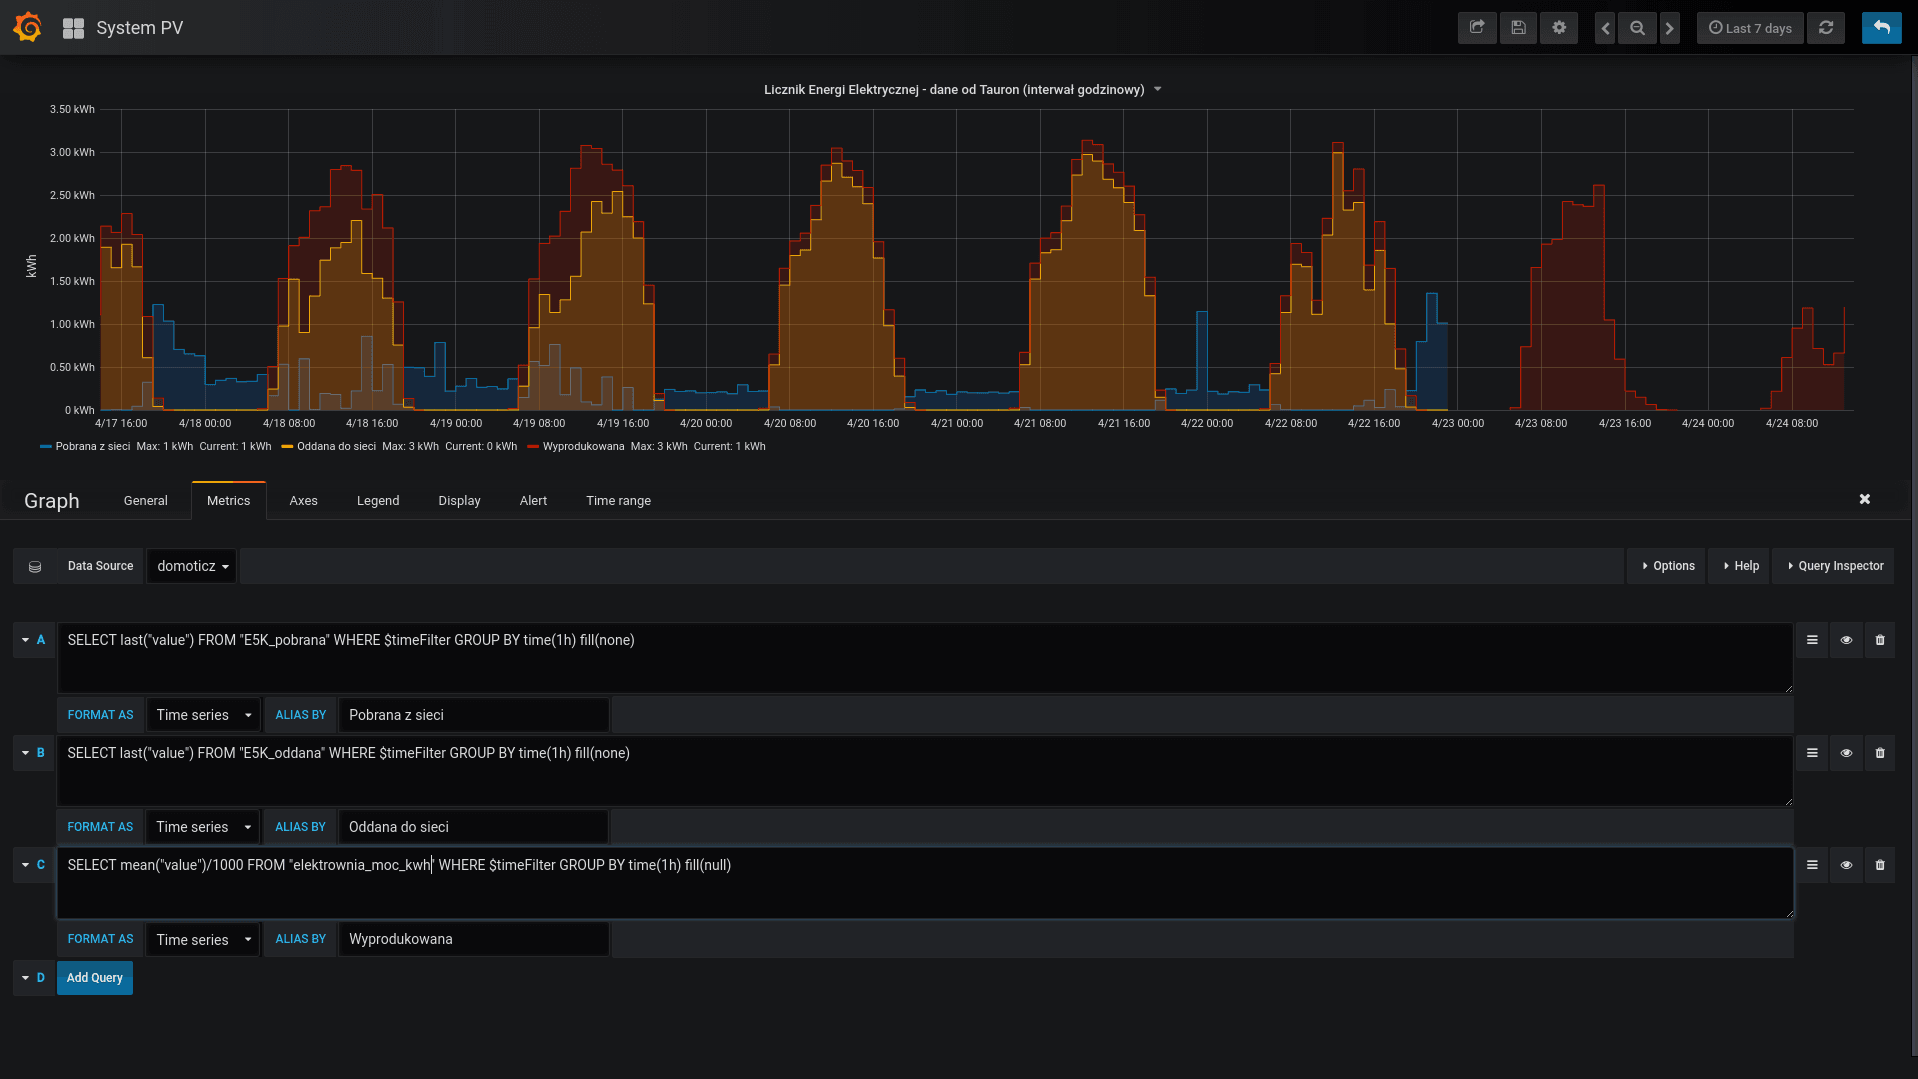
- A script that parses the XLS format and puts it into the InfluxDB database that Grafana uses to generate the following chart:

The effect can be achieved in a number of ways - you can use the work that Piotr Machowski has done - I encourage you to see how he retrieves data for G11/G12 zones.
First - we install InfluxDB and Grafana - if, of course, we want to visualize the data right away: https://blog.jokielowie.com/2016/11/domoticz-cz-5-grafana-influxdb-telegraf-latwe-i-piekne-wykresy/
sudo su -

apt update
apt upgrade

apt install git python-xlrd
apt install python3-pip
pip3 install python3-xlib
apt-get install libjpeg-dev zlib1g-dev
pip3 install pyautogui
apt install scrot python3-tk python3-dev
apt install firefox-esr x11vnc xvfb fluxbox

exit

touch /home/pi/.Xauthority
git clone https://github.com/luciust/TauronPVtoGrafana
cd ~/TauronPVtoGrafana
git clone https://github.com/hempalex/xls2csv
It's time for the first launch and data entry.
In the next part we will deal with the automation of the whole process
After the installation, we move to the classic computer we use every day - we log in to our account at https://elicznik.tauron-dystrybucja.pl/ - we check the box "Energy given to the network", then "Download" and select the range from the menu covering all the time we are interested in - this way we will enter all the historical data into the database the first time. We save the downloaded file - the default name is "Data.xls".
Its format should be identical to that of the attached photo, including pasting the first hour column with the date:

Then, using, for example: Filezilla (user pi, our password - Raspberry IP address, port 22, we connect to the Raspberry Pi and put the file Data.xsl in the directory:
/home/pi/DownloadsIt's time to enter the database - data from Tauron. To do this, enter the IP address and the name of the database, optionally the user/password or key to the installed database:
we edit the file: convert_and_upload_to_influxdb.bash
Lets run it!
cd ~/TauronPVtoGrafana
./convert_and_upload_to_influxdb.bash
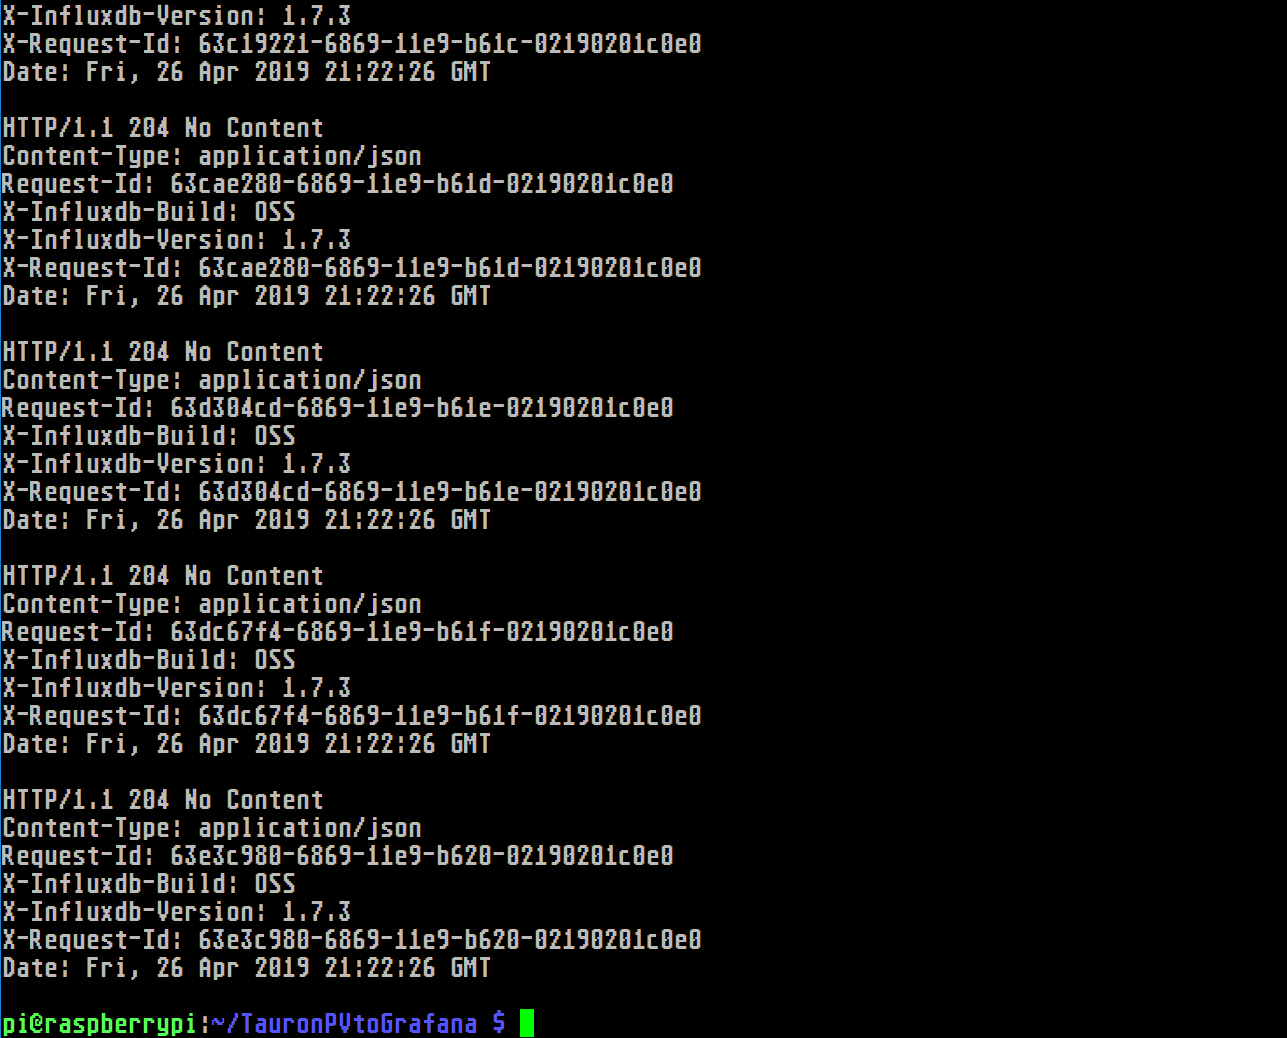
Depending on the solutions used - and the amount of data after a few minutes we should get on the screen:

It's time for visualization - in Grafana we create a new "graph", which has the database of our choice as its source. Then, in the Metrics tab, we select "Toggle Edit Mode" from the right and paste in the A field:
SELECT last("value") FROM "E5K_pobrana" WHERE $timeFilter GROUP BY time(1h) fill(none)In the B field:
SELECT last("value") FROM "E5K_oddana" WHERE $timeFilter GROUP BY time(1h) fill(none)
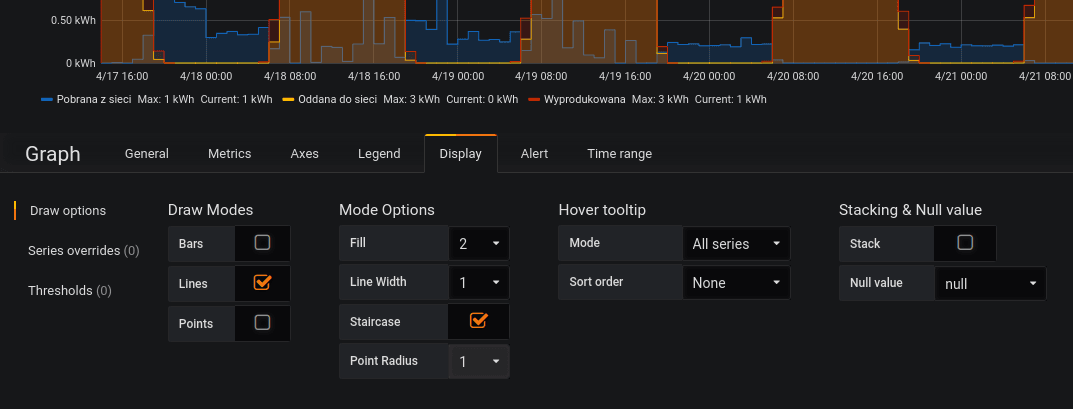
The effect of a stepped graph, which corresponds to the presented values, is achieved as follows:

Note - depending on the clock settings, and the date of the change to winter daylight saving time - Tauron may give data with a difference of, for example: an hour or two. Acutally, from May 2019 it is a shift of two hours, previously it was by one hour. Therefore, you should - if the graph does not coincide - the energy given up against the energy produced - change the words "1 hour ago" to "2 hours ago" in the script.
Process automation
The main goal is to automatically retrieve and present data. To do this, use the provided script:
./TauronPVtoGrafana/cli_get_tauron_data.bashAfter launching it, we get a message that we can connect via the VNC protocol to the GUI environment running Firefox. Here we are using one of the capabilities of System X for Linux, allowing us to create a virtual screen in which programs can run just like in Raspberry Pi's GUI mode. So we run the VCN client (it can be for example: TightVNC) and connect to the address of our Raspberry Pi, no password is needed.
We should get the Tauron eCounter login screen in Firefox. We log in and FINALLY remember the login information (email and password) in Firefox. We check if the download is working - we save the data in the Downloads directory by default (if you changed the language to Polish - you will have to change the scripts to Downloads). We leave firefox, we can close the connection.
Now - we automate! We run the script once again
./TauronPVtoGrafana/cli_get_tauron_data.bashlet's connect through the VNC client as before, but - we return to the console from which we ran the script and type:
export DISPLAY=:1
./tauron-cli-browser-job.py3
After 4 seconds, the mouse cursor should start moving, clicking, until the data is retrieved and Firefox automatically closes - this will take a while, as we leave ourselves time for the page to load. If something goes wrong - because the web page of the elicitor will change - we have to in the file:
tauron-cli-browser-job.py3make changes - move the cursor, add some delay. This, of course, is easy to write, so - I recorded a short video that shows the whole operation:
Is it working? So, the last step - running an automaton that will download data on its own in a timely manner and upload it to InfluxDB:
crontab -eand add at the end:
SHELL=/bin/bash
PATH=~/bin:/usr/bin/:/bin

50 7 * * * /home/pi/TauronPVtoGrafana/get_tauron_data.bash > /tmp/log-tauron-get-data-cron.txt 2>&1
which will allow it to run automatically at 7:50 a.m. every day, and what the script recorded while running - that is, the log - will be found in the /tmp directory
That's it!

This work is licensed under a Creative Commons Attribution-NonCommercial-NoDerivatives 4.0 International License (c) 2014-2024 Łukasz C. Jokiel, [CC BY-NC-SA 4.0 DEED](https://creativecommons.org/licenses/by-nc-sa/4.0/)