Domoticz cz. 5: Grafana, Influxdb and Telegraf – beautiful and easy to use charts
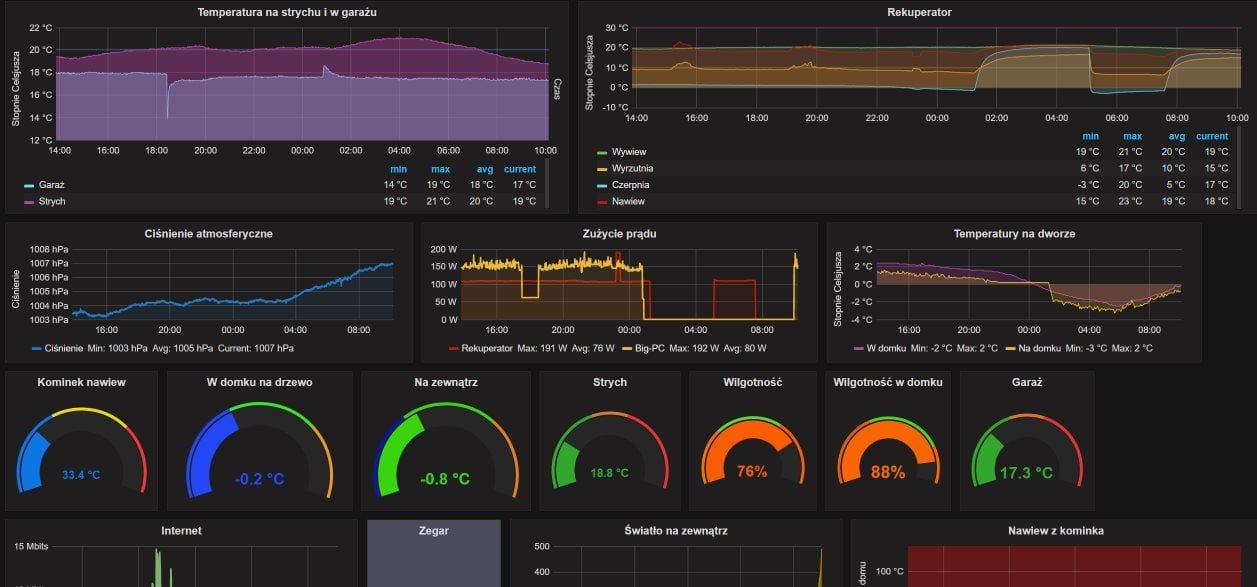
Grafana is the answer to the nagging question we’be been asking ourselves over the years – how to quickly and nicely present our data gathered from devices. InfluxDB on the other hand is the database that is as easy and simple to use, thus making it an ideal candidate for this job.
Let me show you how to quickly and easily put our data from domoticz and other devices to InfluxDB and then using Grafana – display in much more useful way than default domoticz graphs do.
Update: 2019-07-10: PhantomJS i Grafana 5/6.x na ARM
What will you need?
Software
- InfluxDB
- Grafana
- some bash scripts
Hardware
- Raspberry Pi – 4B+/5
OPTION: Raspberry Pi A/B/B+ lub Zero (armv6)
OPTION: A different ARM based micro-computer (i.e.: OPi PC” rel=”noopener” target=”_blank”>Official Store – OrangePi PC using CPU H3/H2/H5) – they could be cheaper. It’s also entirely possible to use x86 computer with Debianem, but it’s going to eat way more than 4-6W when using ARM based. Here I used finally Orange Pi PC with latest armbian distribution, tested first on latest Raspberry Pi 2
Intallation
InfluxDB
Let’s download https://www.influxdata.com/downloads/ latest InfluxDB version (at the time of writting it was 1.0.2) – “Standalone Linux Binaries (ARM)”:
cd /tmp
wget https://dl.influxdata.com/influxdb/releases/influxdb-1.0.2_linux_armhf.tar.gz
Next - we have to create user influxdb:
sudo adduser influxdbAccept the questions with yes, add some data if you like, password.
Check if the user exists:
id influxdbWe should get similar, positive response:
uid=1001(influxdb) gid=1001(influxdb) grupy=1001(influxdb)Now, let’s install from influxdb binary:
sudo tar xzf influxdb-1.0.2_linux_armhf.tar.gz
cd influxdb-1.0.2-1
cp -R * /
sudo chown influxdb:influxdb -R /etc/influxdb
sudo chown influxdb:influxdb -R /var/log/influxdb
sudo mkdir -p /var/lib/influxdb
sudo chown influxdb:influxdb -R /var/lib/influxdb
sudo cp /usr/lib/influxdb/scripts/init.sh /etc/init.d/influxdb
sudo chmod 755 /etc/init.d/influxdb
sudo cp /usr/lib/influxdb/scripts/influxdb.service /etc/systemd/system
All went well? Let’s start our InfluxDB:
/etc/init.d/influxdb startIt works! Let’s make sure it starts with the system, this time using a different tool:
sudo apt-get install rcconfRun it, push space to get “*” at influxdb.
Grafana
TThis time it’s a bit easier let’s use the ready package from https://github.com/fg2it/grafana-on-raspberry/. Choose a package either for Raspberry Pi 2/3 (armv7) or for Raspberry Pi A/B/B+ lub Zero (armv6), and download it using wget. Here I’m using Raspberry Pi 2/3 package:
sudo apt-get install adduser libfontconfig
wget https://github.com/fg2it/grafana-on-raspberry/releases/download/v3.1.1-wheezy-jessie/grafana_3.1.1-1472506485_armhf.deb
sudo dpkg -i grafana_3.1.1-1472506485_armhf.deb
This package tells us to add Grafana to start with the system in this way:
sudo /bin/systemctl daemon-reload
sudo /bin/systemctl enable grafana-server
Let’s start grafana:
sudo /bin/systemctl start grafana-serverConfiguration
Aktualne wersje InfluxDB zarządzamy poprzez linię komend (CLI)::
pi@host:~$ influx
Connected to http://localhost:8086 version 1.2.2
InfluxDB shell version: 1.2.2
Creating database is easy, issue:
create DATABASE domoticz
quit
pi@host:~$
The older version of InfluxDB by default use the web interface – by using IP of our Raspberry at port 8083. Basic configuration allows unauthorized access via http. This is the interface:
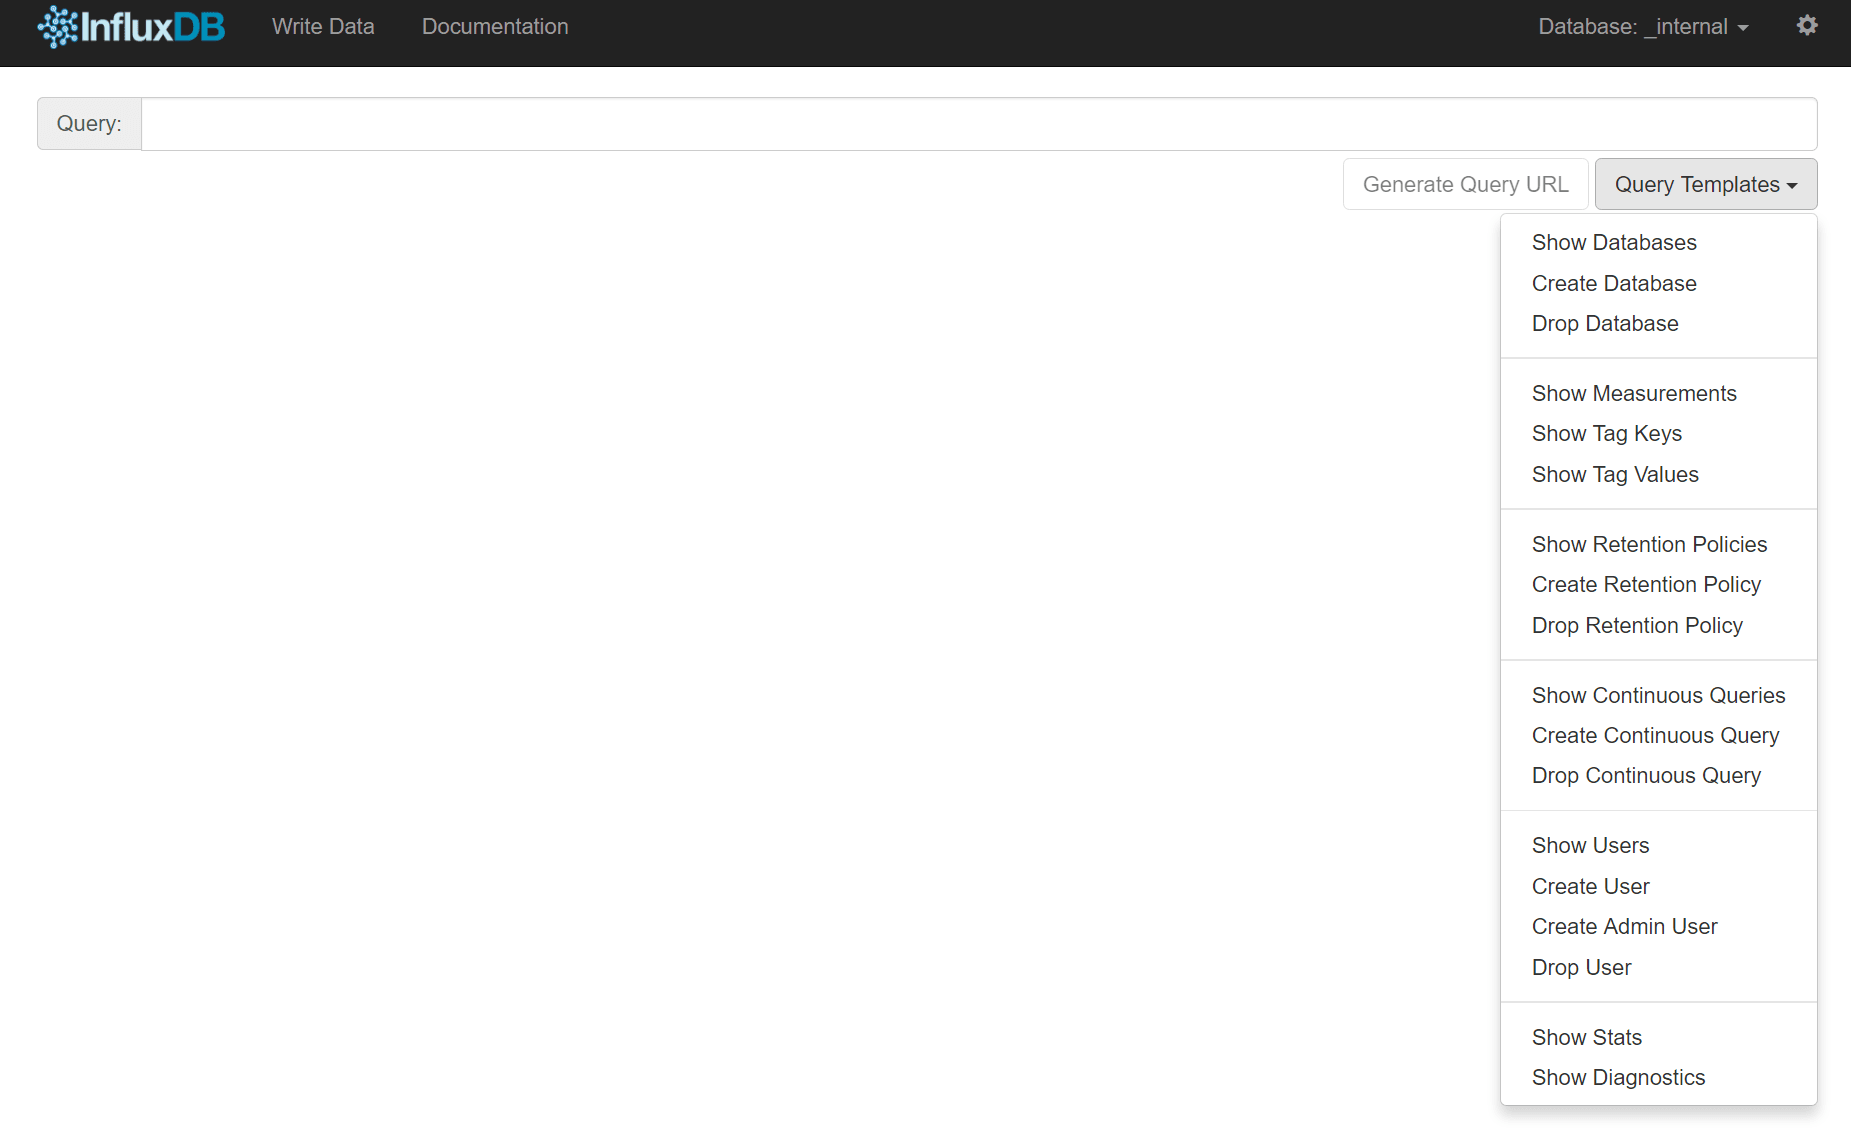
so, let’s just choose “Create Database”, and name our first database “domoticz”:
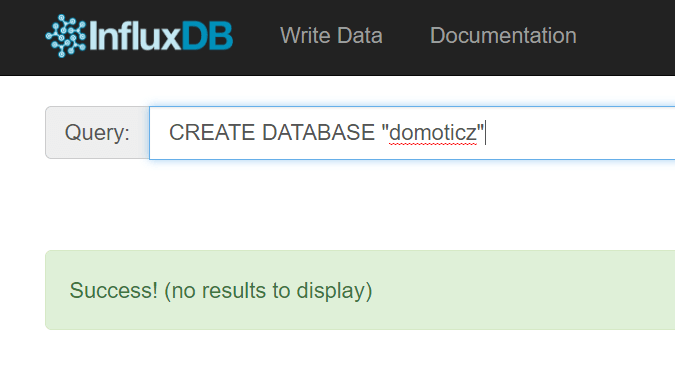
That is it! Either with http interface or CLI – no need to create data, tables – we can simply add data to it.
Sending from domoticz to InfluxDB
Using Domoticz – use the menu and select “HTTP”:
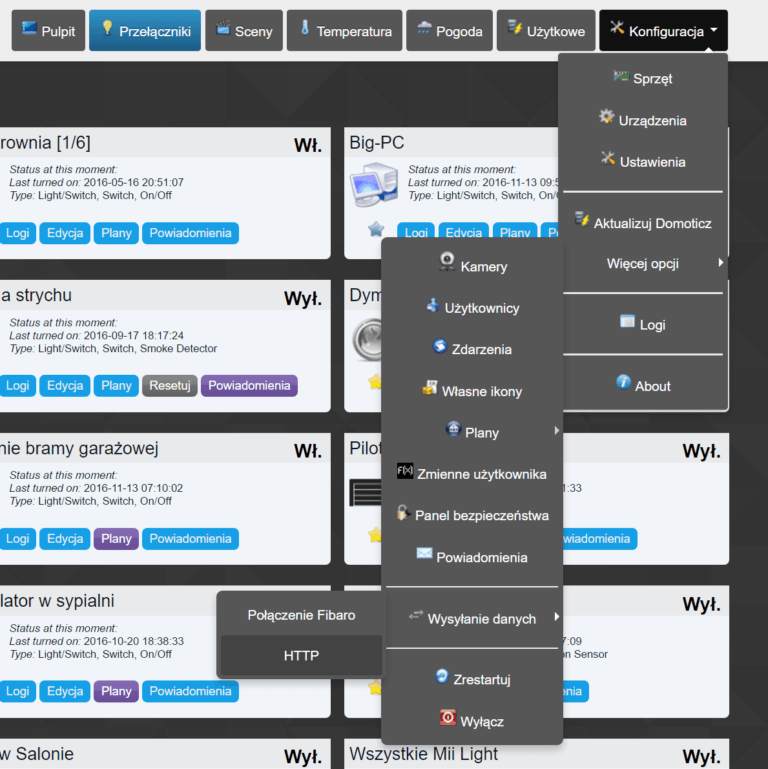
We need to find data that is interesting and put it into Influxdb – so let’s choose atmospheric pressure:

So how does this work? First, we choose a variable – our data, that is already in Domoticz system – from menu “Device name”. Then – we need a number to identify – I use the same as the IDX number of the device in domoticz – so here it’s “1450”. Tick the “Activate connection”, at the right side and provide URL that will be our connection via http to write toInfluxdb: IP, port – this time it’s 8086, database name, username/password if used and precision.
Method is HTTP POST, authorization – let’s leave that for later.
The most important part is the “Data:” here we enter our InfluxDB variable, that we going to use later to create graphs, it’s value and time. Keeping things small and simple, we shall call it “device_1450“. Use tshark, if you’re curious how the URL’s work, what is the response (HTTP code 204 if it’s fine). That is it – data will be stored in “domoticz”, database, no need to create types, indexes, tables – quite new approach, eh?
Sending data from any device (not domoticz)
Since InfluxDB is so easy going, everybody is getting ideas. We talk via HTTP, meaning that we can put the data using simple tools i.e. using curl, a popular program present in each modern distribution.:
apt-get install curlHere’s and example on how to use it:
#!/bin/bash
predkosc_in=25000
predkosc_out=11000
curl -i -XPOST 'http://10.1.1.1:8086/write?db=snmp' --data-binary "inwisp,host=wisp value=${predkosc_in}"
curl -i -XPOST 'http://10.1.1.1:8086/write?db=snmp' --data-binary "ouwisp,host=wisp value=${predkosc_out}"
This very simple example uses SNMP (the old 32-bit counters) that queries the wireless interface to ISP, to show the “Internet speed”. curl is used here to send the data to database named “snmp”, the valiable is inwisp for Input and outwisp for Output, but to spice up things a bit – we use host (it’s optional), to be able to later group the devices. Then the value – which is the speed. We don’t put extra time value – we use the current system time.
The whole script – below (it’s much easier to use telegraf, but I still love the MRTG’s approach to collect data) is an 17 yeras old 17 bash script!. I used it via screen while starting the system same way as with the – Flightradar and SDR blog entry.
#!/bin/bash
#This script reads the interface speed in bits (actually the number of bits tru interface) using old 32-bit counters
#Licencja: GPL v2
#Author: [email protected]
#History:
#1999-06-22/23 - Initial version to test the MRTG way of doing things
#2016-11-12 - Adopted to serve as simple example for Grafana blog entry, some changes to modernize and simplify it a bit using new bash functions

#Setting up the variables
#Number (index) of the monitred interface snmpwalka
int_number=5
#SNMP community name, by default it is "public"
community=public_secret
#IP of the router that we want to monitor
router_ip=10.1.1.45
#How often do we check?
how_often=300
#Maximum values that we expect - by default its 25/4. We need that to filter out counter resets and errors
max_possible_in=25000000000
max_possible_out=4000000000
#Glowna petla - czytamy wartosci czekamy zadany czas i czytamy je znowu - odejmujemy od siebie aby wyznaczyc predkosc (tam na dole petli)
while [ 1 -eq 1 ]
do
 octety_wtedy_in=$(snmpget -v1 -c $community $ip_rutera 1.3.6.1.2.1.2.2.1.10.$numer_interfejsu | awk '{print $4}')
 octety_wtedy_out=$(snmpget -v1 -c $community $ip_rutera 1.3.6.1.2.1.2.2.1.16.$numer_interfejsu | awk '{print $4}')
 sleep $co_ile_sekund
 octety_teraz_in=$(snmpget -v1 -c $community $ip_rutera 1.3.6.1.2.1.2.2.1.10.$numer_interfejsu | awk '{print $4}')
 octety_teraz_out=$(snmpget -v1 -c $community $ip_rutera 1.3.6.1.2.1.2.2.1.16.$numer_interfejsu | awk '{print $4}')

#Najpierw sprawdzamy czy czasem nie będziemy dzielić przez zero, oraz czy się licznik nie przepełnił... Jesli cos jest nie tak to wartosc na 1
 if [ $octety_wtedy_in -eq $octety_teraz_in ]
 then
  octety_teraz_in=$((octety_teraz_in+1))
 fi

 if  [ $octety_wtedy_in -gt $octety_teraz_in ]
 then
  octety_wtedy_in=$((octety_teraz_in+1))
 fi

 if [ $octety_wtedy_out -eq $octety_teraz_out ]
 then
  octety_teraz_out=$((octety_teraz_out+1))
 fi

 if  [ $octety_wtedy_out -gt $octety_teraz_out ]
 then
  octety_wtedy_out=$((octety_teraz_out+1))
 fi

 #Maly debug - wyswietlamy ile nam wyszlo
 echo Wtedy In: $octety_wtedy_in
 echo Wtedy Out: $octety_wtedy_out
 echo Teraz In: $octety_teraz_in
 echo Teraz Out: $octety_teraz_out

 #Liczymy roznice

 roznica_in=$((octety_teraz_in-octety_wtedy_in))
 roznica_out=$((octety_teraz_out-octety_wtedy_out))

 #Jeszcze raz sprawdzamy czy nie mamy zlego wyniku (poprzednie nie wylapia jednej sytuacji... no jakiej?)
 if [ $roznica_in -lt 0 ]
 then
  roznica_in=1
 fi

 if [ $roznica_out -lt 0 ]
 then
  roznica_out=1
 fi

 if [ $roznica_in -gt $max_possible_in ]
 then
  roznica_in=1
 fi

 if [ $roznica_out -gt $max_possible_out ]
 then
  roznica_out=1
 fi
 #Mamy nasza predkosc
 predkosc_in=$(((($roznica_in)/$co_ile_sekund)*8/1000))
 predkosc_out=$(((($roznica_out)/$co_ile_sekund)*8/1000))
 clear
 #Czyscimy kosnsole aby usunac poprzednie wyniki
 echo "Prędkość IN: "${predkosc_in}"kbps"
 echo "Prędkość OUT: "${predkosc_out}"kbps"
 #Saving data in snmp database InfluxDB
 curl -i -XPOST 'http://10.1.1.1:8086/write?db=snmp' --data-binary "inwisp,host=wisp value=${predkosc_in}"
 curl -i -XPOST 'http://10.1.1.1:8086/write?db=snmp' --data-binary "ouwisp,host=wisp value=${predkosc_out}"
done
The stored data in snmp database should give you the following reply:
HTTP/1.1 204 No Content
Request-Id: a11318b7-a590-11e6-cea7-000000000000
X-Influxdb-Version: 0.11.0
Date: Sun, 13 Nov 2016 11:02:39 GMT
The other way to find out if we’re in the database is to use the Influxdb HTTP interface and issue from the menu – SHOW MEASUREMENTS:

Grafana – finally we’re getting to the beautiful graphs!
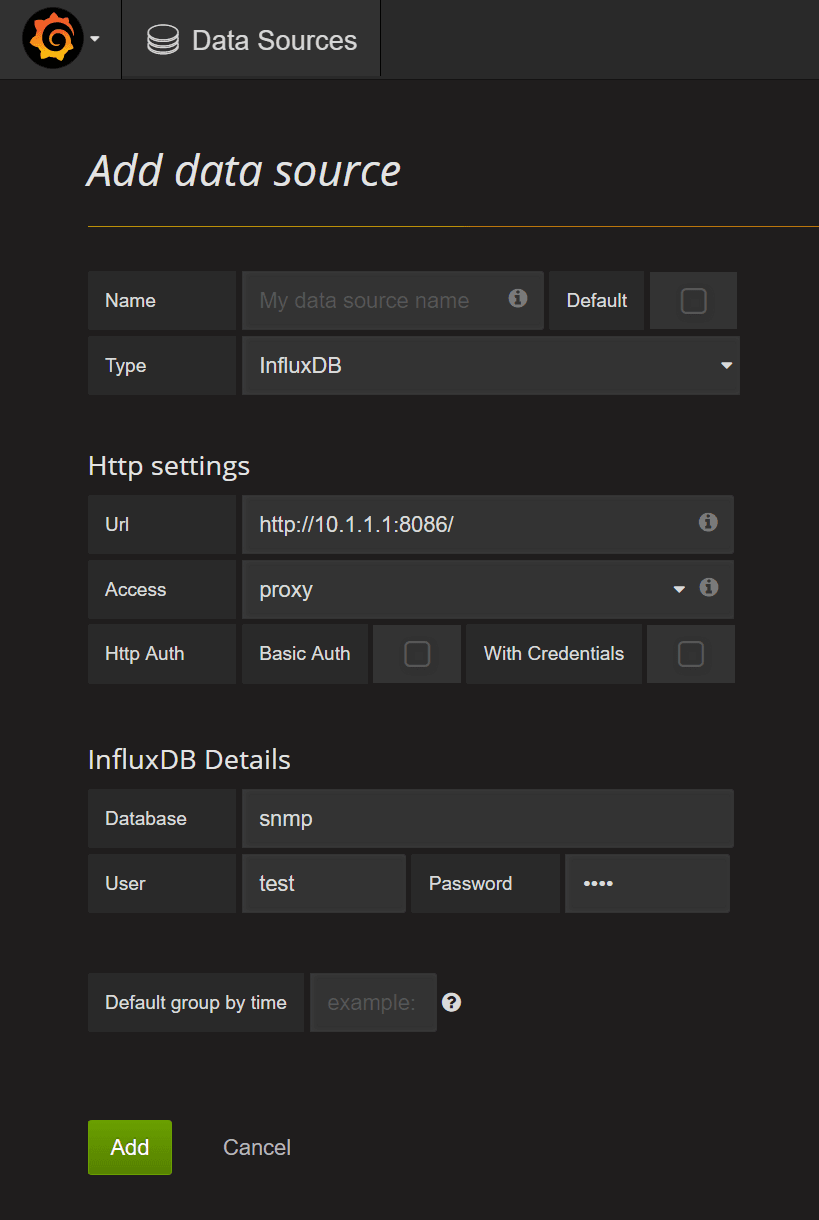
Grafana runs on port 3000, login and password admin/admin – now choose in left top corner – Data Sources. Add Source and type in – Type, URL, Access at proxy, user and password for the database:
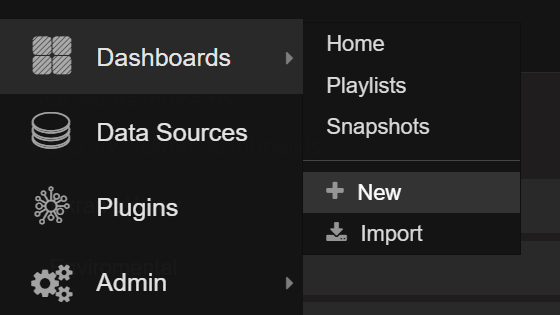
If the data source is working – we can go to “Dashboard” and create our first:
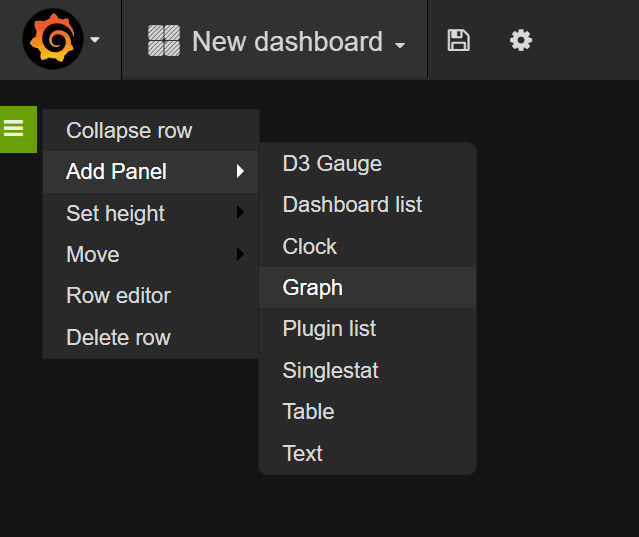
Next – let’s add our first graph:
Now we see the default panel with single data series to plot/graph. It looks nice, but this is not our data yet:
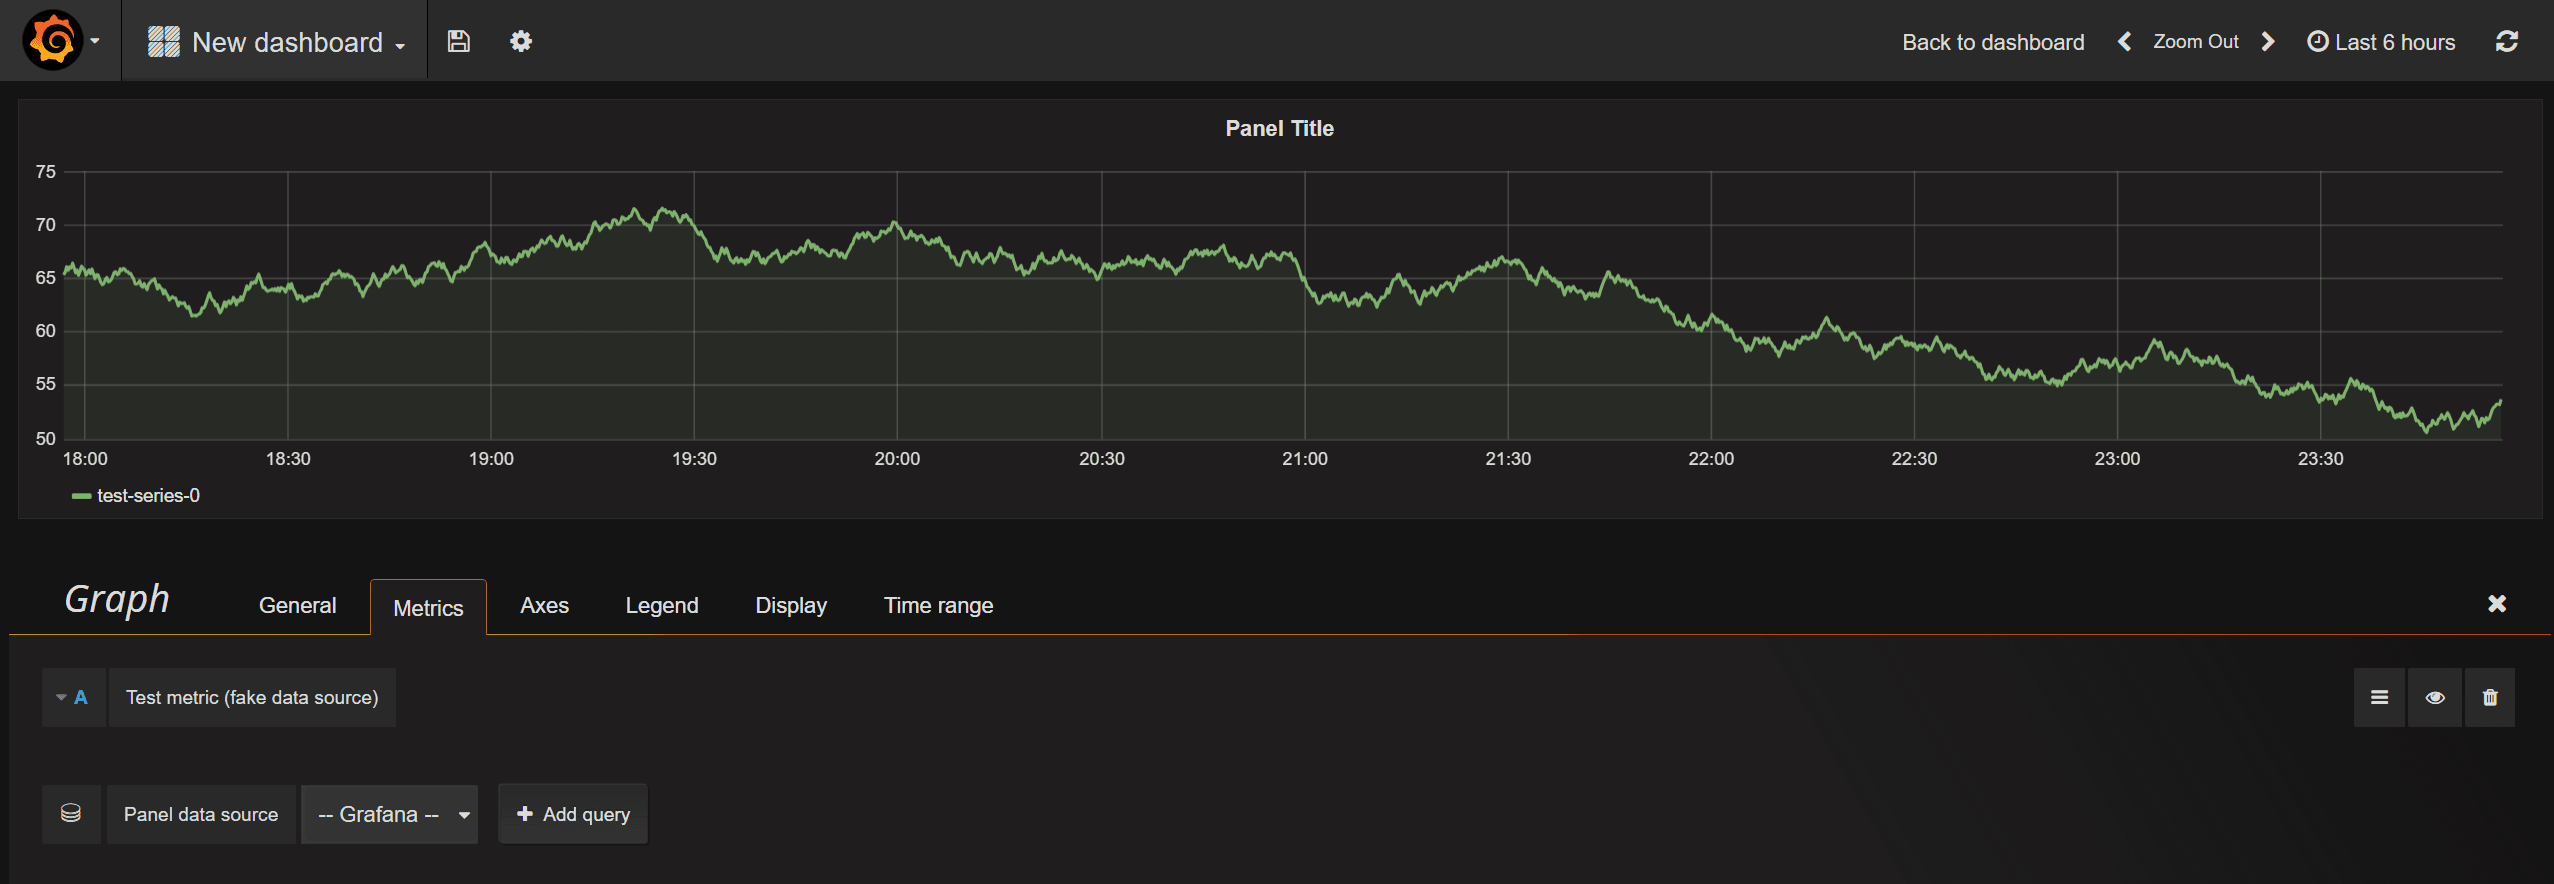
Next step – select our database from the “Panel data source” – change from -Grafana- to SNMP. “A” – our data series should look like this:


Green line is gone, because we need to provide correct data – we do it in the same way – changing to the edit mode in the query “A” and fill in just like in exemple below. Next choose again SNMP “+ Data query” and fill in the “B” query – all changes are updated on the fly:
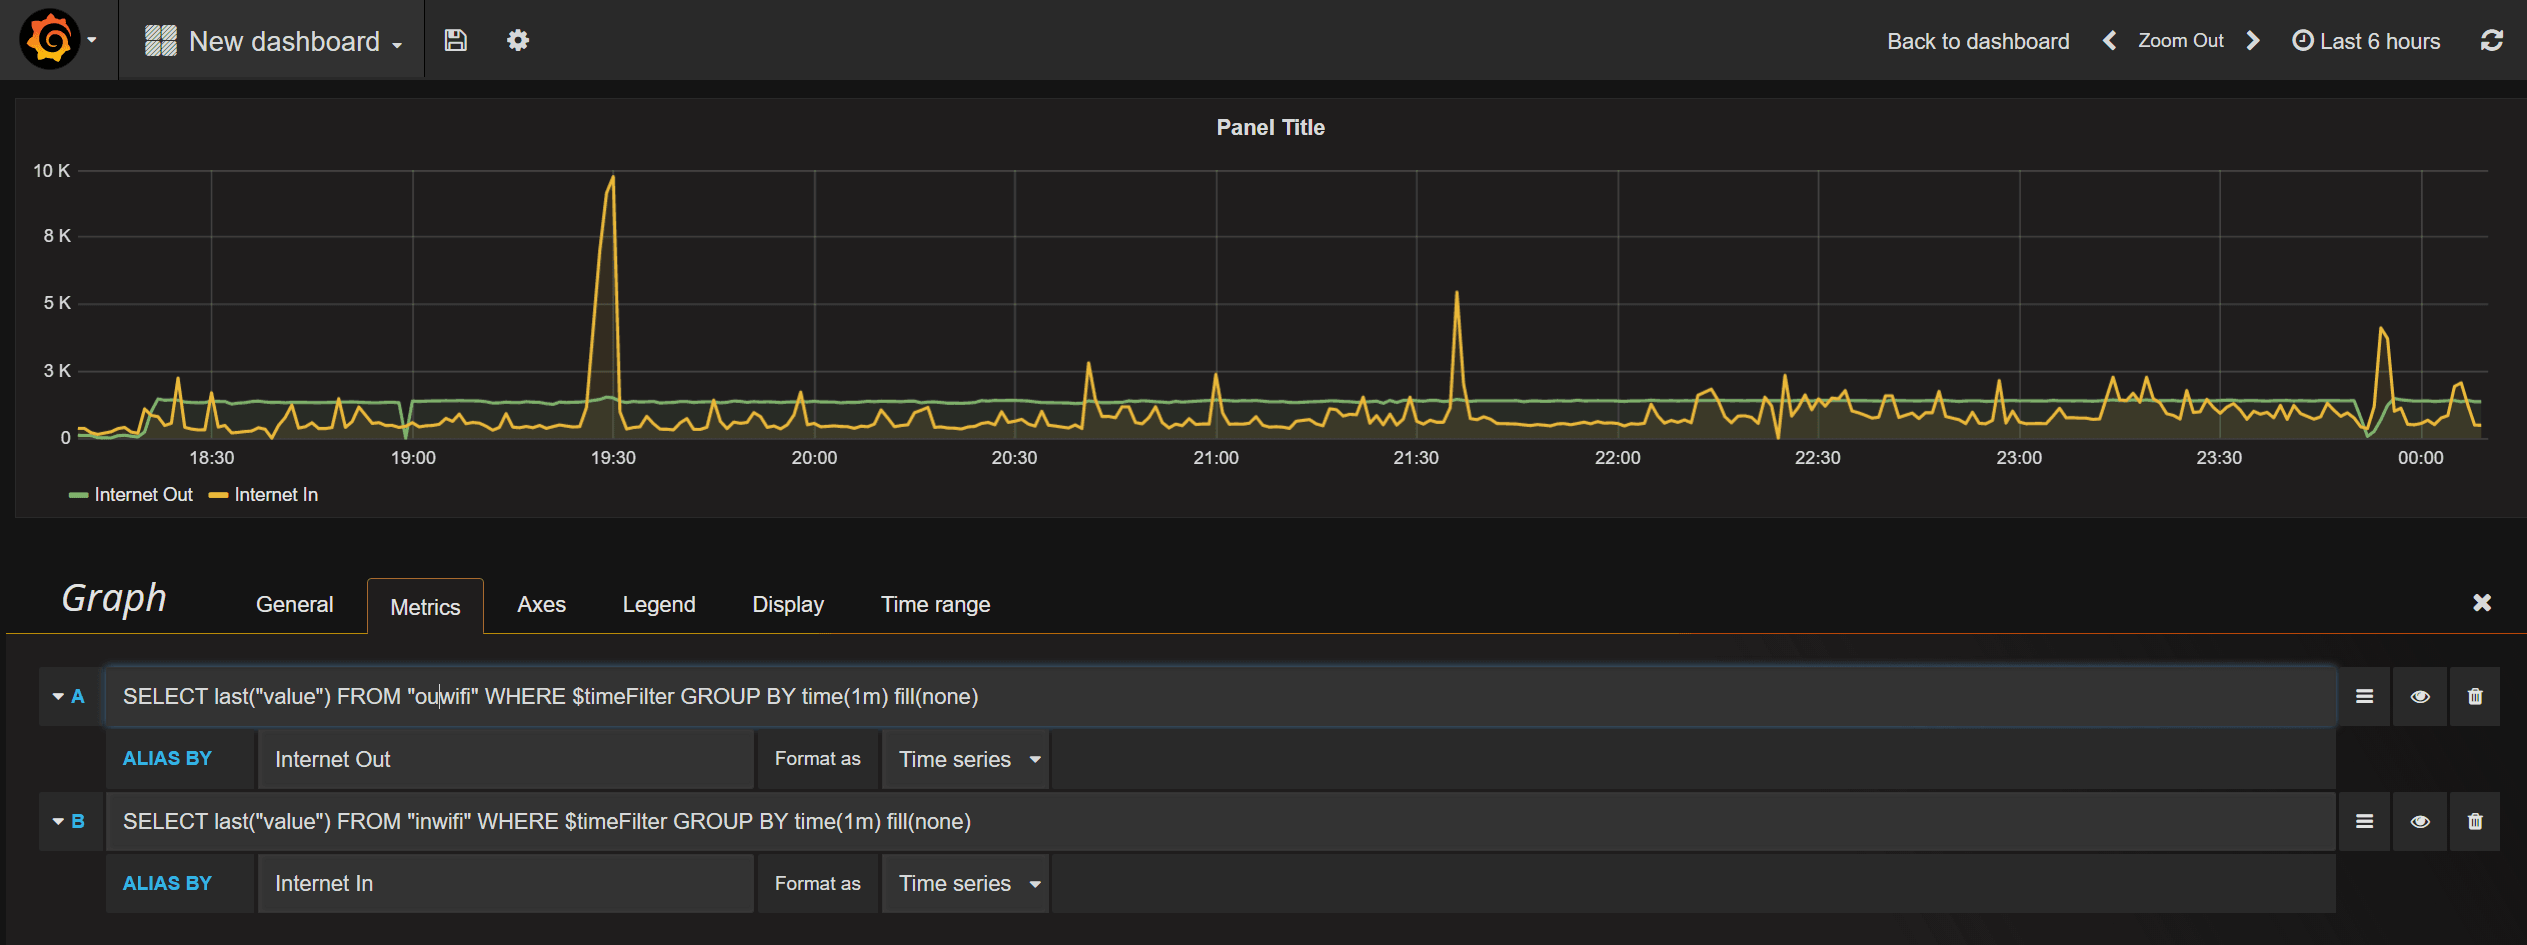
Go to “Axes” menu – here, select proper data type – “Unit”, “data rate” -> “kilobits/sec”. In the “General” name the Panel “Internet” and this is it. The floppy disc icon saves our new dashboard:

It’s time now to install aditional grafana puligns to get more of the graphs, gauges etc: https://grafana.net/plugins
Telegraf
The last interesting piece of software is Telegraf. This a very feature-rich piece of monitoring software, that is able to gather data from aplication statues, interfaces, CPU, and runs also on Linux> Simple installation follows simple configuration.
First – create new databes in InfluxDB – “telegrafPI” but this time using command line:
pi@orangepipic-grafana:~$ influx
Visit https://enterprise.influxdata.com to register for updates, InfluxDB server management, and monitoring.
Connected to http://localhost:8086 version 1.1.0
InfluxDB shell version: 1.1.0
create database telegrafPI
Now let’s install telegraf:
We can either add repository:
deb https://repos.influxdata.com/debian jessie stableto
/etc/apt/sources.listor get appropriate pacakge from:
wget https://dl.influxdata.com/telegraf/releases/telegraf-1.1.2_linux_armhf.tar.gz
tar xvfz telegraf-1.1.2_linux_armhf.tar.gz
or even use
wget https://repos.influxdata.com/debian/pool/stable/t/telegraf/telegraf_1.1.1-1_armhf.deb
dpkg -i telegraf_1.1.1-1_armhf.deb
Configuration is dead simple telegraf pre-configures the file based on what we tell it to, then we should save it in:
/etc/telegrafSo to get you started lets monitor CPU:
sudo mkdir -p /etc/telegraf
sudo telegraf --config telegraf.conf -input-filter cpu:mem -output-filter influxdb > /etc/telegraf/telegraf.conf/
Based that this is the same computer we monitor where influxdB is installed – of not – choose proper IP of the DB host.
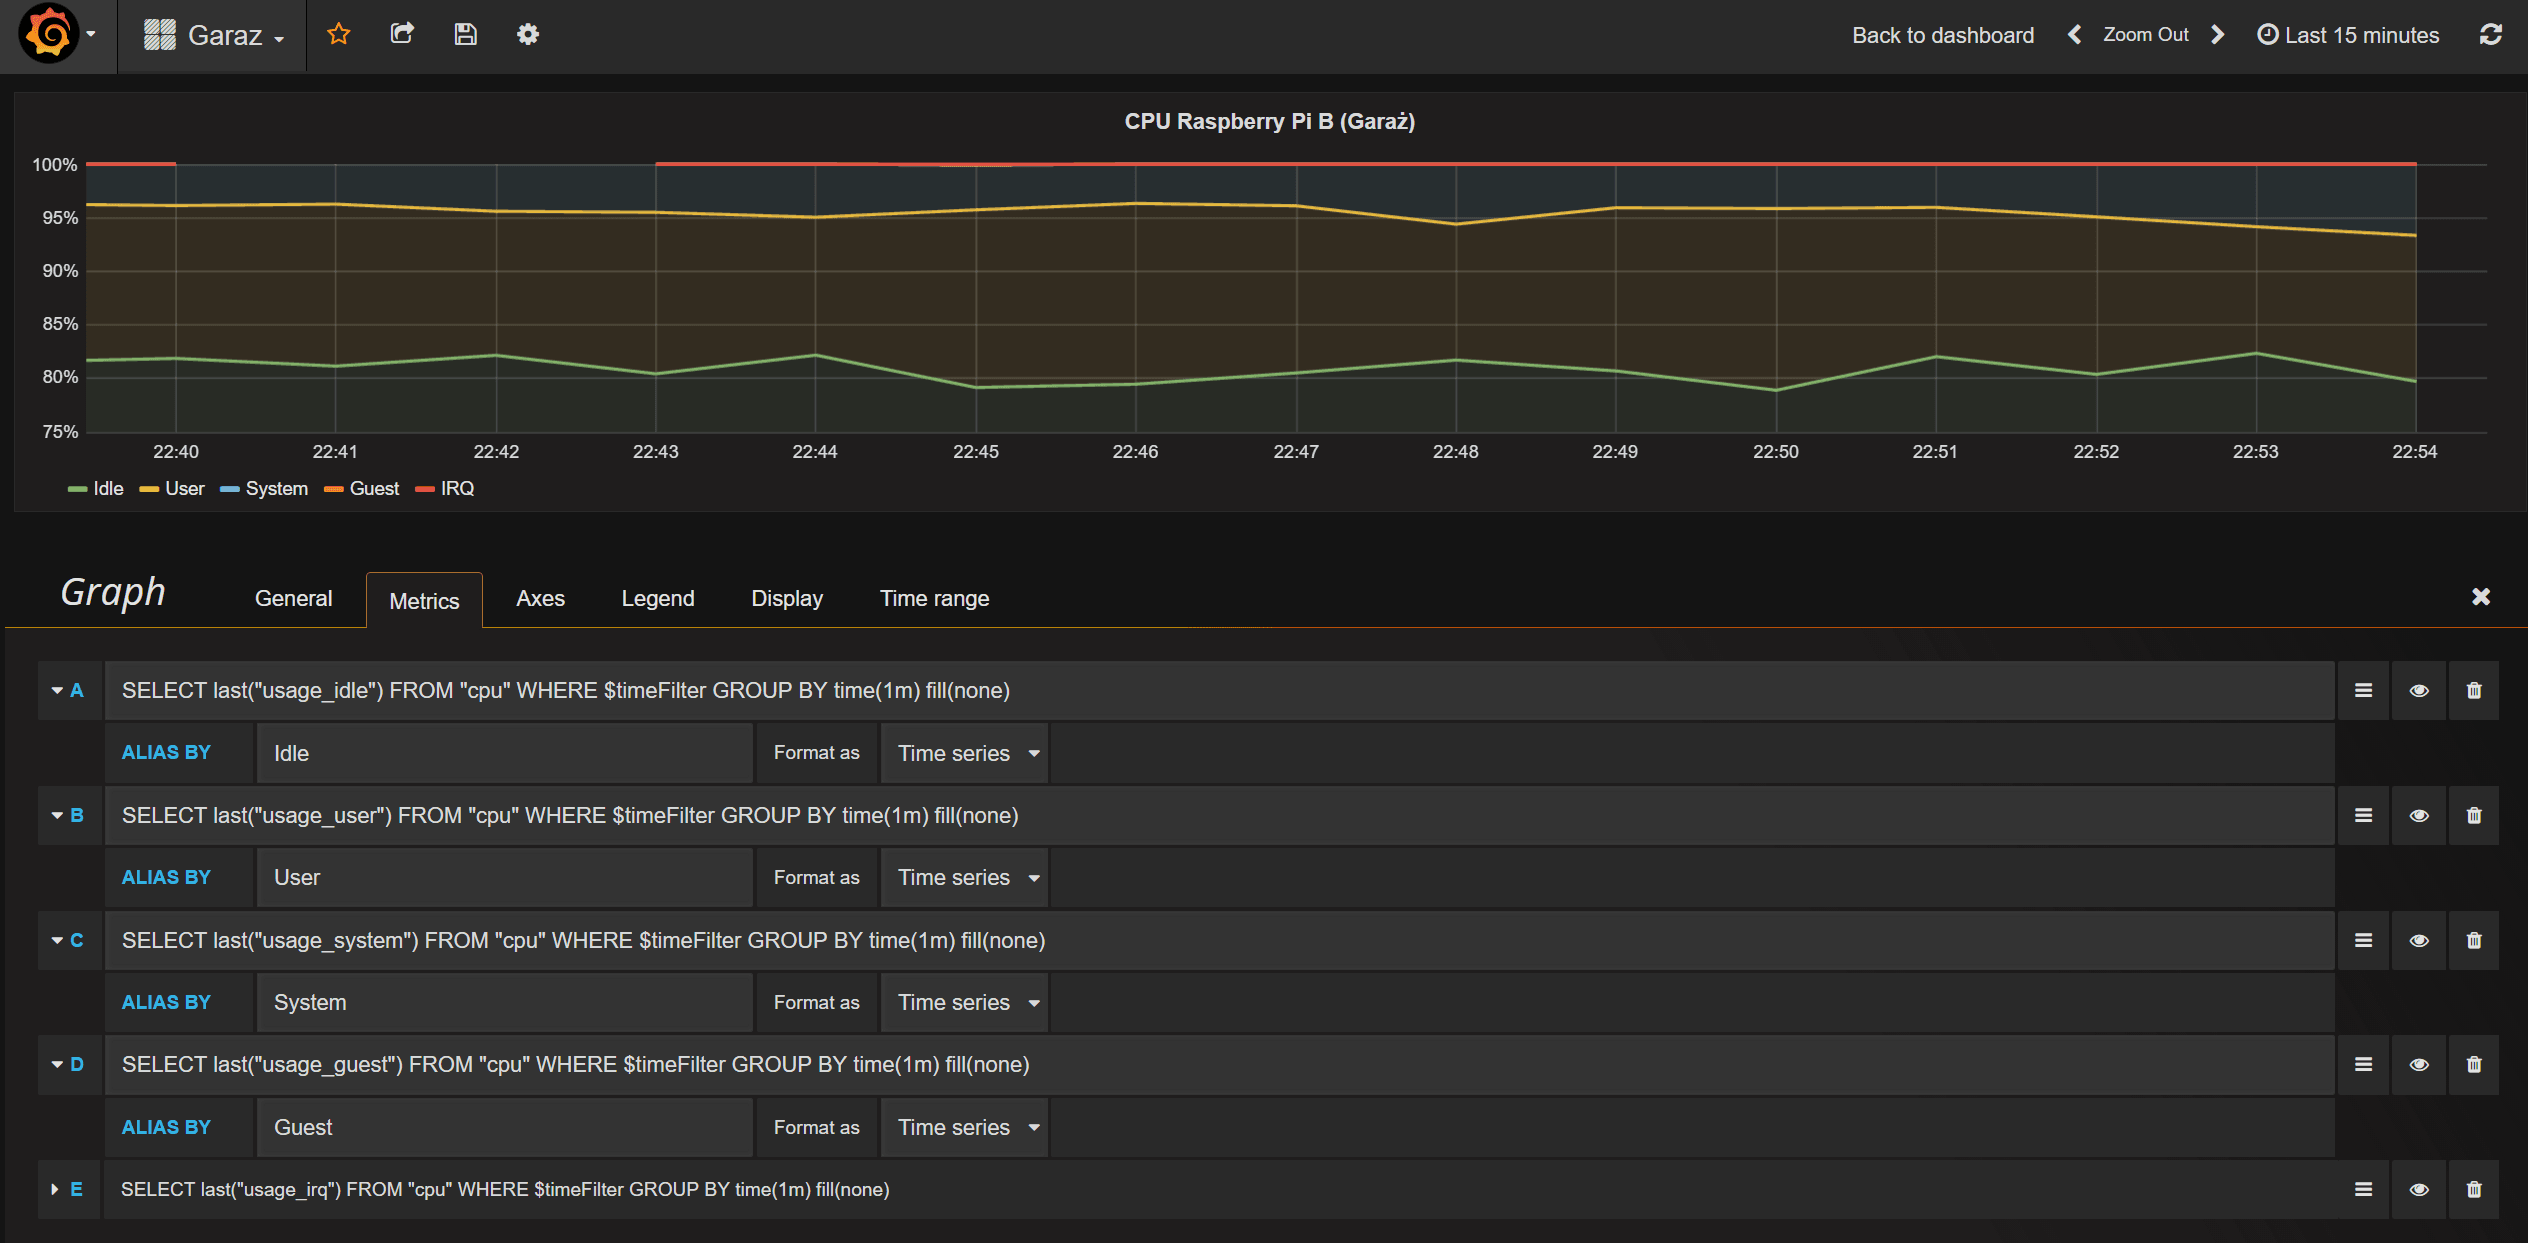
In Grafana – after adding new database source, we’re using the following data series for plotting:
A: SELECT last("usage_idle") FROM "cpu" WHERE $timeFilter GROUP BY time(1m) fill(none)
B: SELECT last("usage_user") FROM "cpu" WHERE $timeFilter GROUP BY time(1m) fill(none)
C: SELECT last("usage_system") FROM "cpu" WHERE $timeFilter GROUP BY time(1m) fill(none)
D: SELECT last("usage_guest") FROM "cpu" WHERE $timeFilter GROUP BY time(1m) fill(none)
E: SELECT last("usage_irq") FROM "cpu" WHERE $timeFilter GROUP BY time(1m) fill(none)
To get the result below, tick the “Stacked” in Display tab:
Other projects
Grafana with InfluxDB is also used in the SMOG measurements..
Grafana versions 5.x and 6.x and missing PhantomJS
Have noticed that screenshot functionality is no longer working? There’s no PhantomJS bundled with Grafana for Rasbperry Pi (and armfh) – so you cannot save it to *.PNG.
What does the error look like:
Jun 10 19:12:01 grafana grafana-server[268]: 2019/07/10 19:12:01 [render.go:41 RenderToPng()] [E] Failed to render to png:
 fork/exec /var/lib/grafana/vendor/phantomjs/phantomjs: no such file or directory
or
lvl=eror msg="executable not found" logger=rendering executable=/usr/share/grafana/tools/phantomjs/phantomjs
lvl=eror msg="Rendering failed - PhantomJS isn't included in arm build per default" logger=context userId=1 orgId=1 uname=admin error="PhantomJS executable not found"
Or simply:
 To restore the screenshot functionality:
- download from https://github.com/fg2it/phantomjs-on-raspberry/blob/master/rpi-2-3/wheezy-jessie/v2.1.1/phantomjs_2.1.1_armhf.deb latest version here we got the RPi version (select Download link or copy the link and use wget/curl on RPi)
- install:
sudo dpkg -i phantomjs_2.1.1_armhf.deb - issue:
cd /usr/share/grafana/tools/phantomjs
sudo ln -s /usr/local/bin/phantomjs
This brings back the screenshots.
And this is it, go and create beautiful graphs!

This work is licensed under a Creative Commons Attribution-NonCommercial-NoDerivatives 4.0 International License (c) 2014-2024 Łukasz C. Jokiel, [CC BY-NC-SA 4.0 DEED](https://creativecommons.org/licenses/by-nc-sa/4.0/)